Daily Gamma Exposure (GEX) Institutional Analysis
Gamma Exposure (GEX) Analysis for Selected Tickers
Data pulled on 2026-07-27 20:19:09 EST from Yahoo Finance.
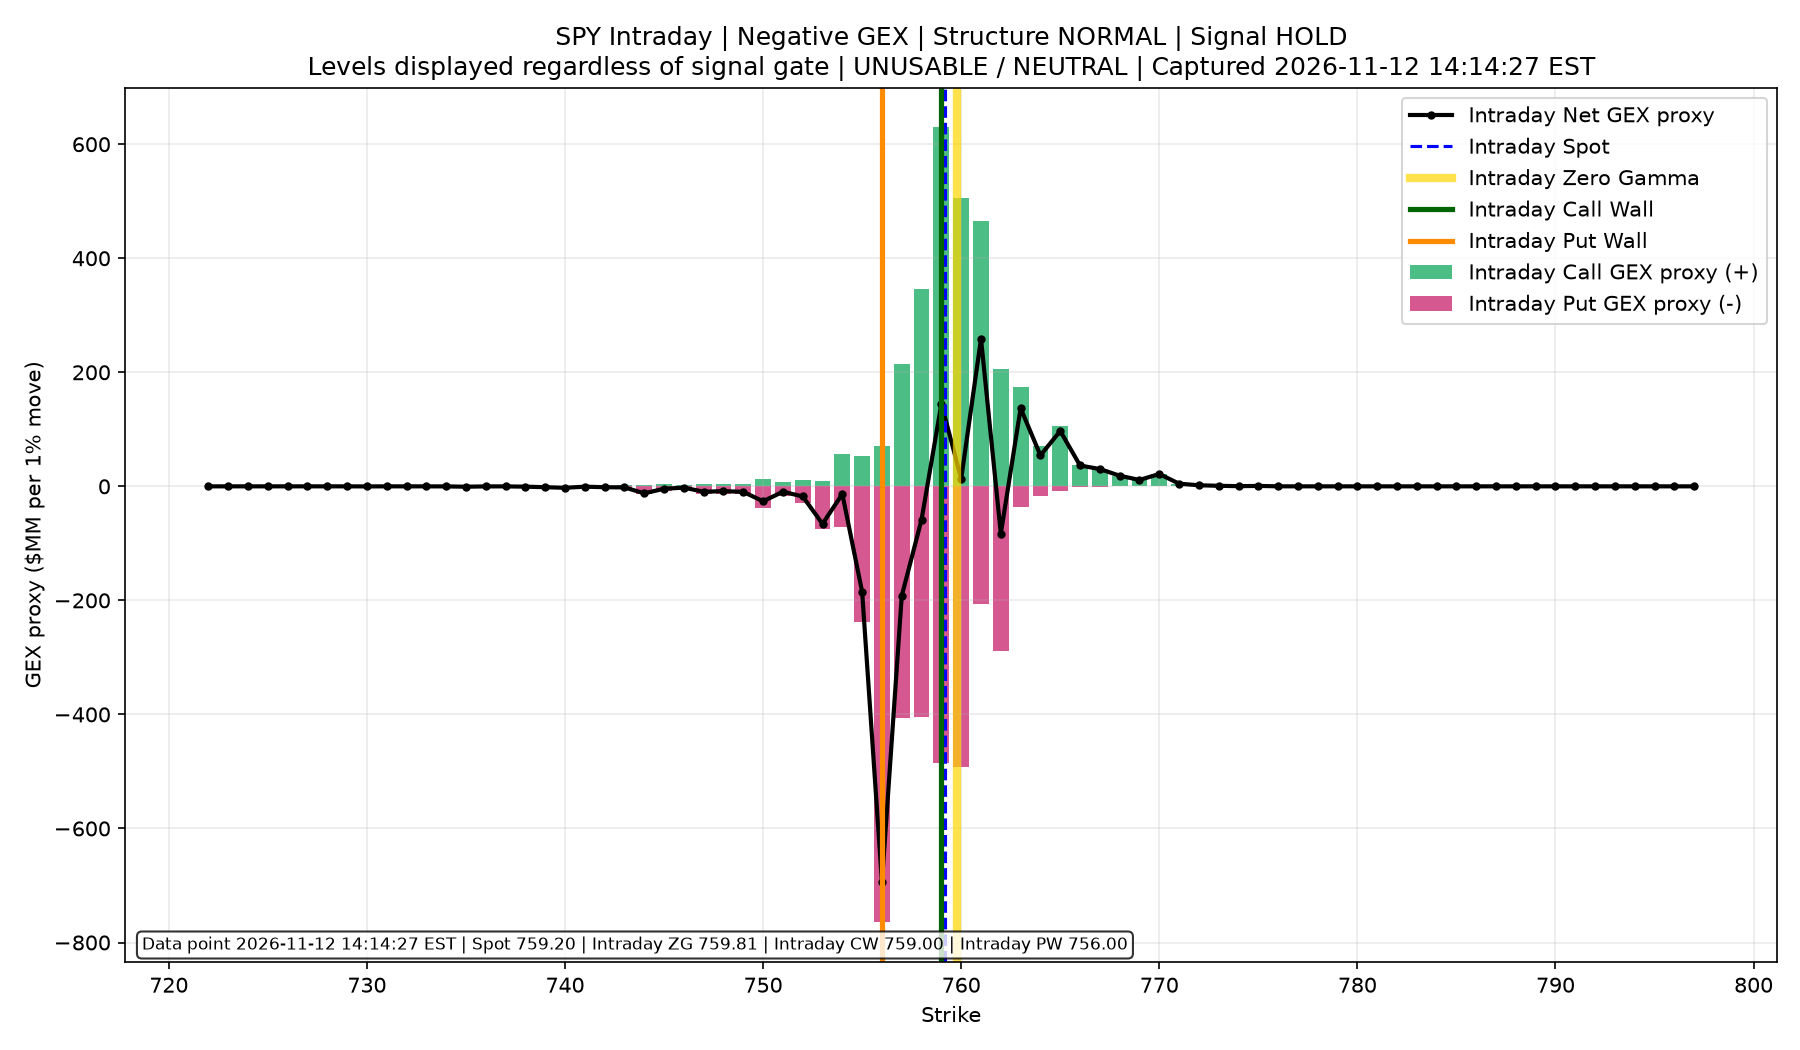
SPY
- Current Price: $154.87
- Call Wall (Resistance): $739.00
- Put Wall (Support): $739.00
- Market Regime: Negative (Dealers Amplifying Volatility)
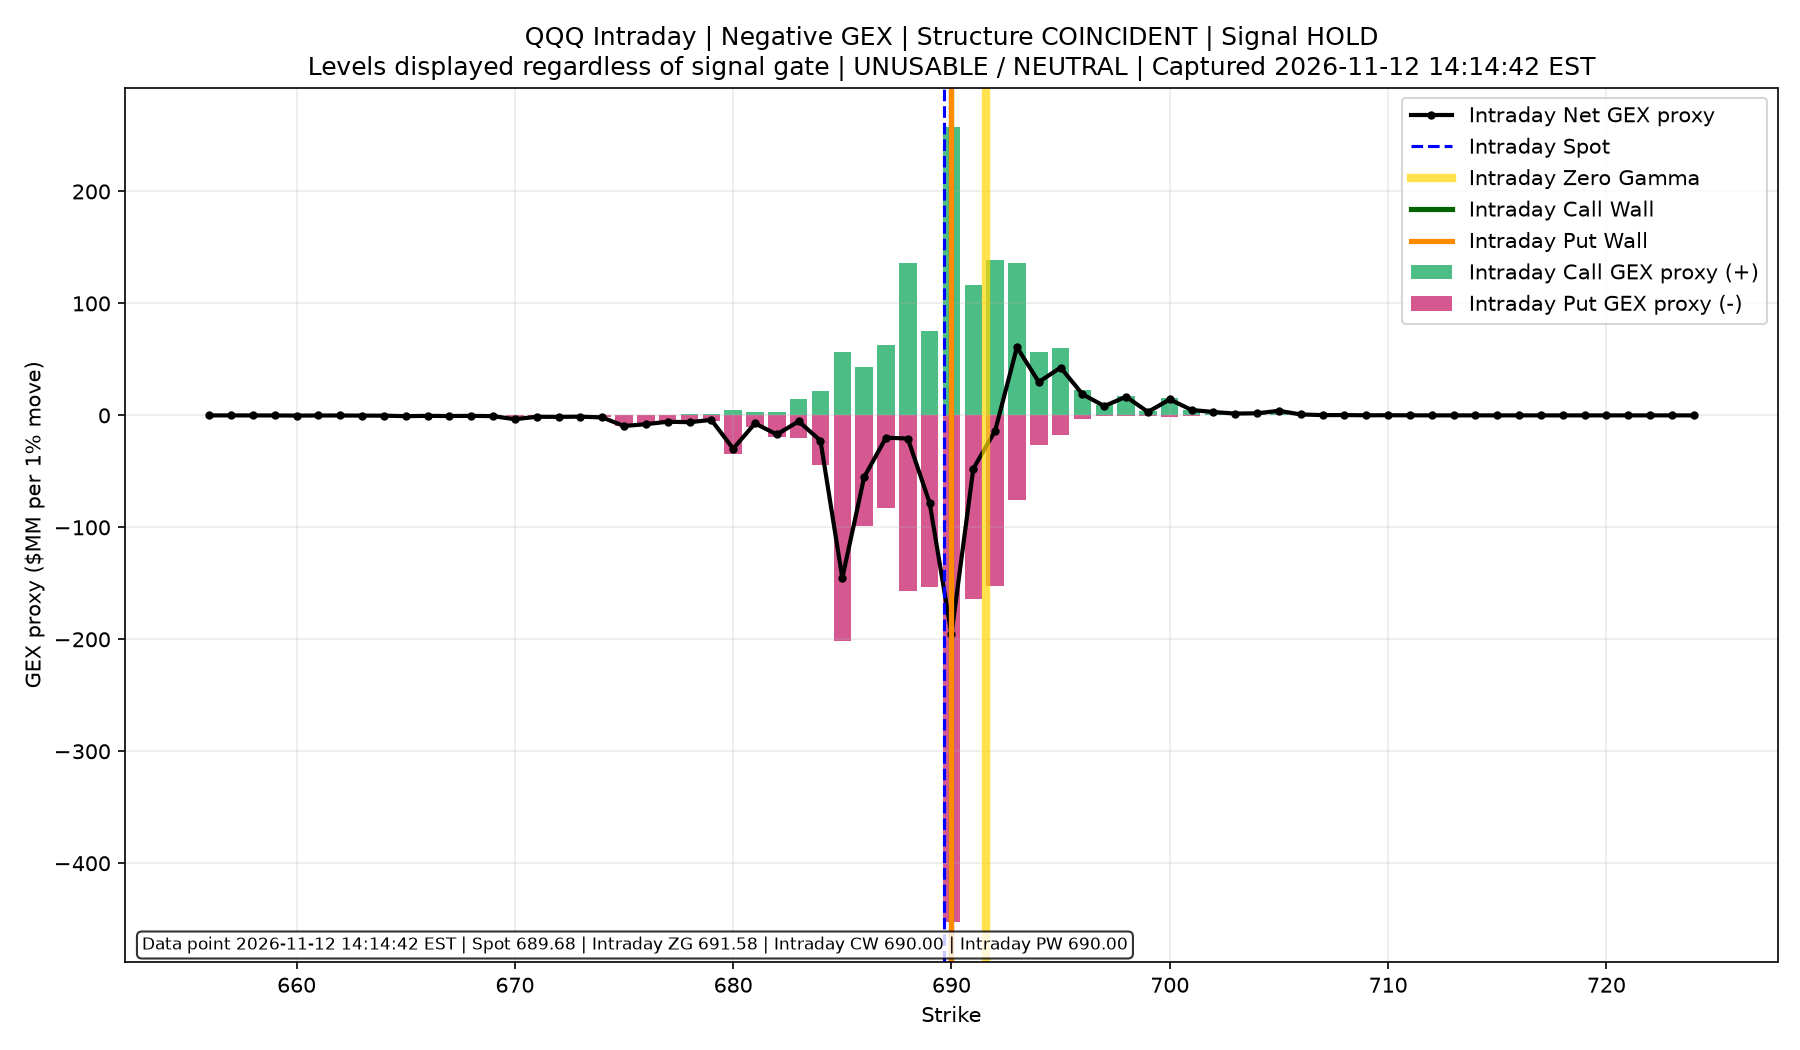
QQQ
- Current Price: $154.87
- Call Wall (Resistance): $683.00
- Put Wall (Support): $680.00
- Market Regime: Negative (Dealers Amplifying Volatility)
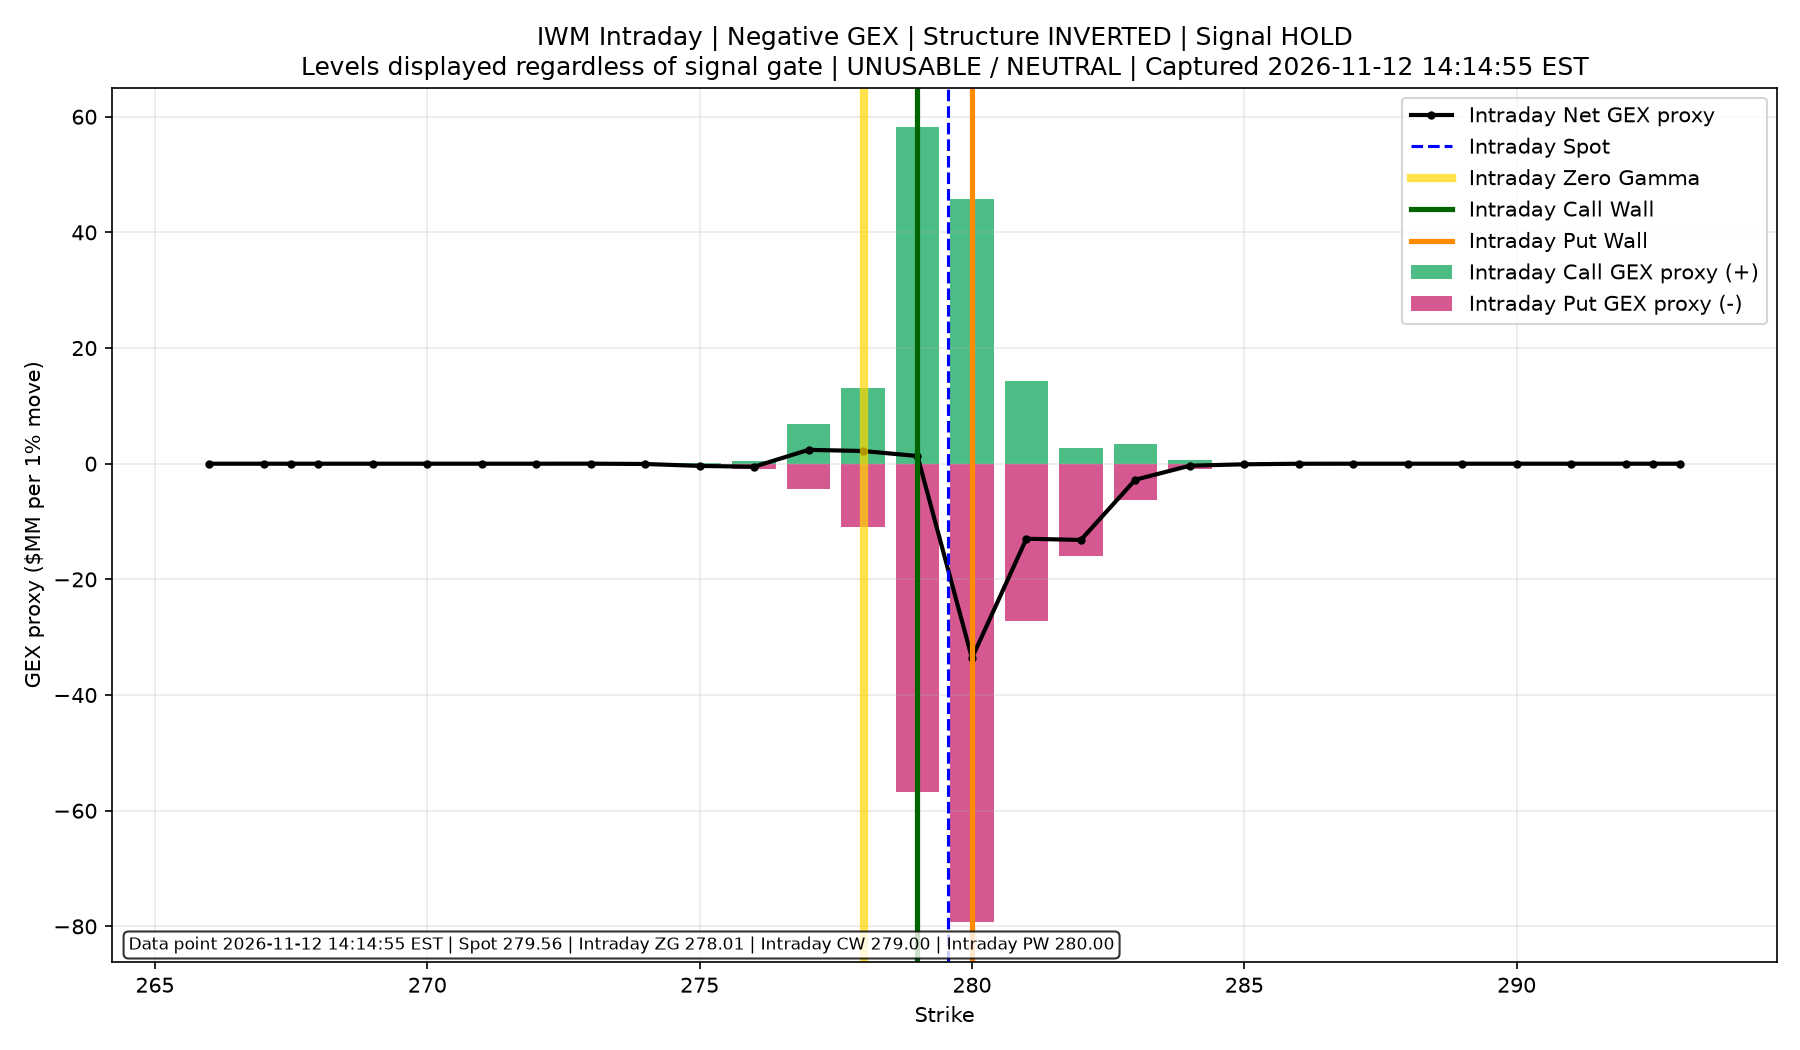
IWM
- Current Price: $154.87
- Call Wall (Resistance): $293.00
- Put Wall (Support): $293.00
- Market Regime: Negative (Dealers Amplifying Volatility)
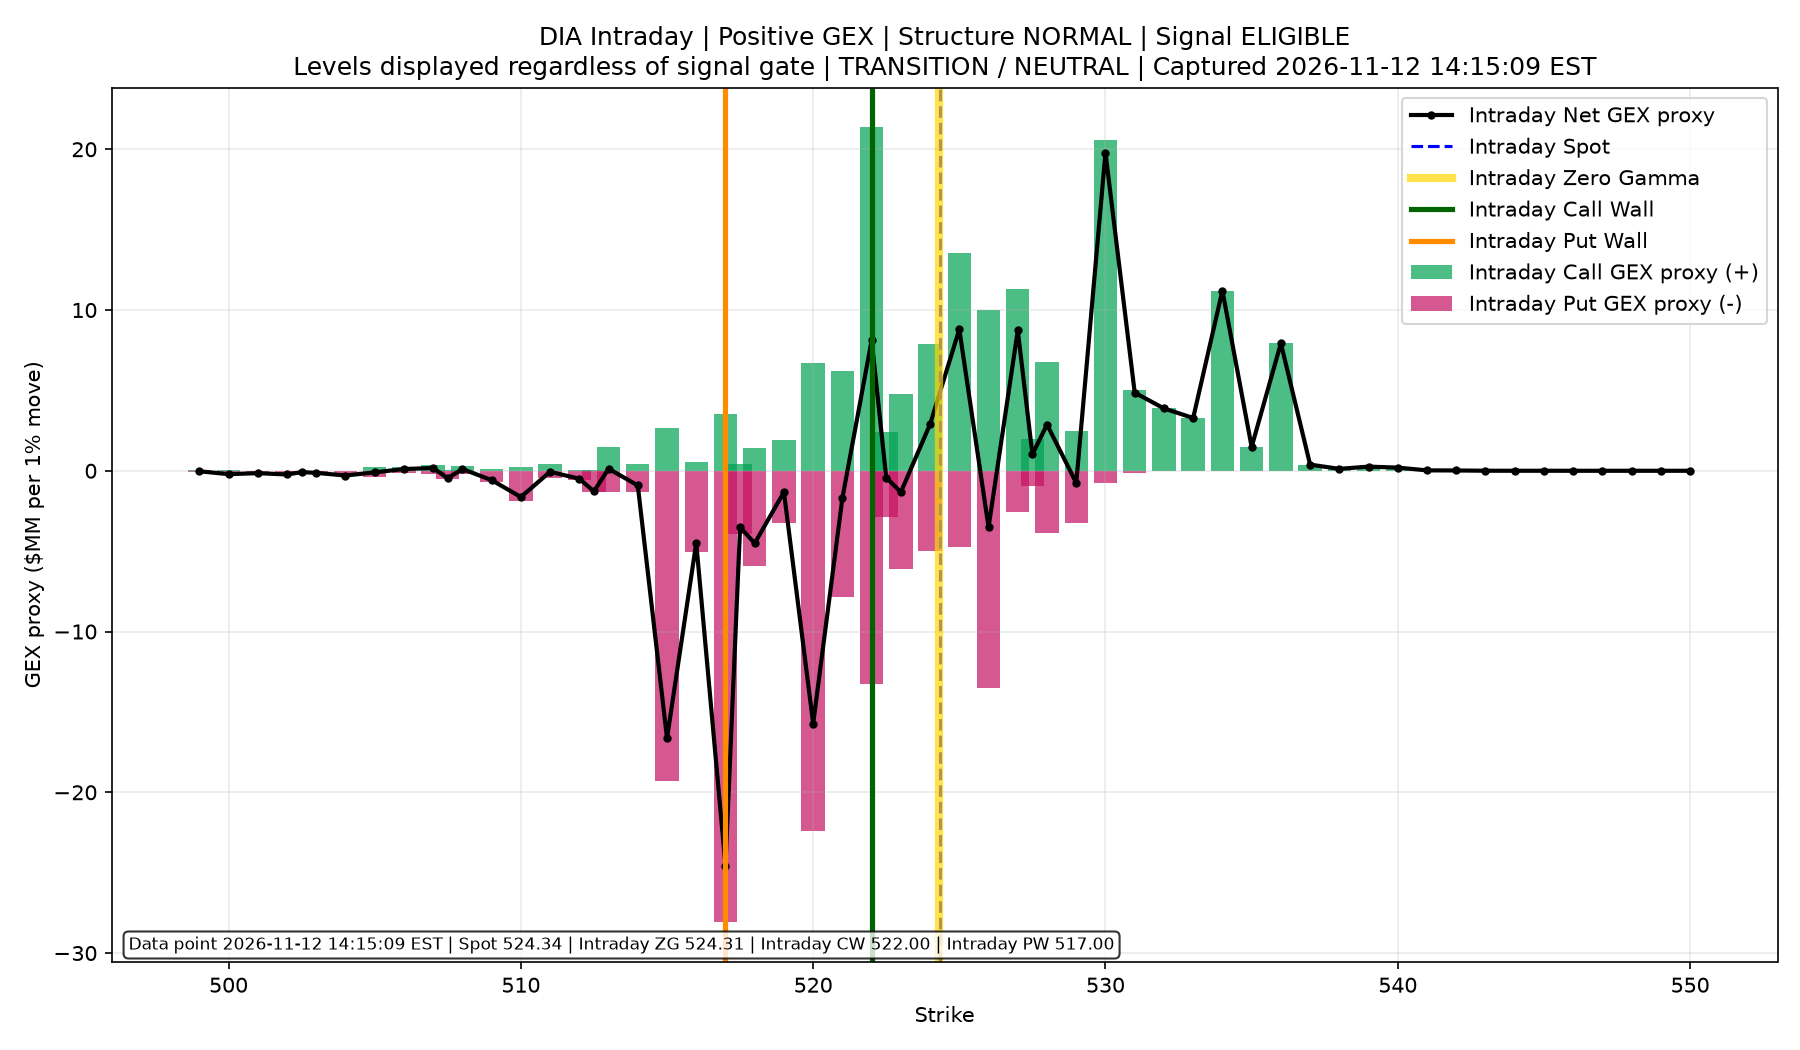
DIA
- Current Price: $154.87
- Call Wall (Resistance): $525.00
- Put Wall (Support): $518.00
- Market Regime: Negative (Dealers Amplifying Volatility)
^VIX
- Current Price: $154.87
- Call Wall (Resistance): $19.00
- Put Wall (Support): $18.00
- Market Regime: Negative (Dealers Amplifying Volatility)
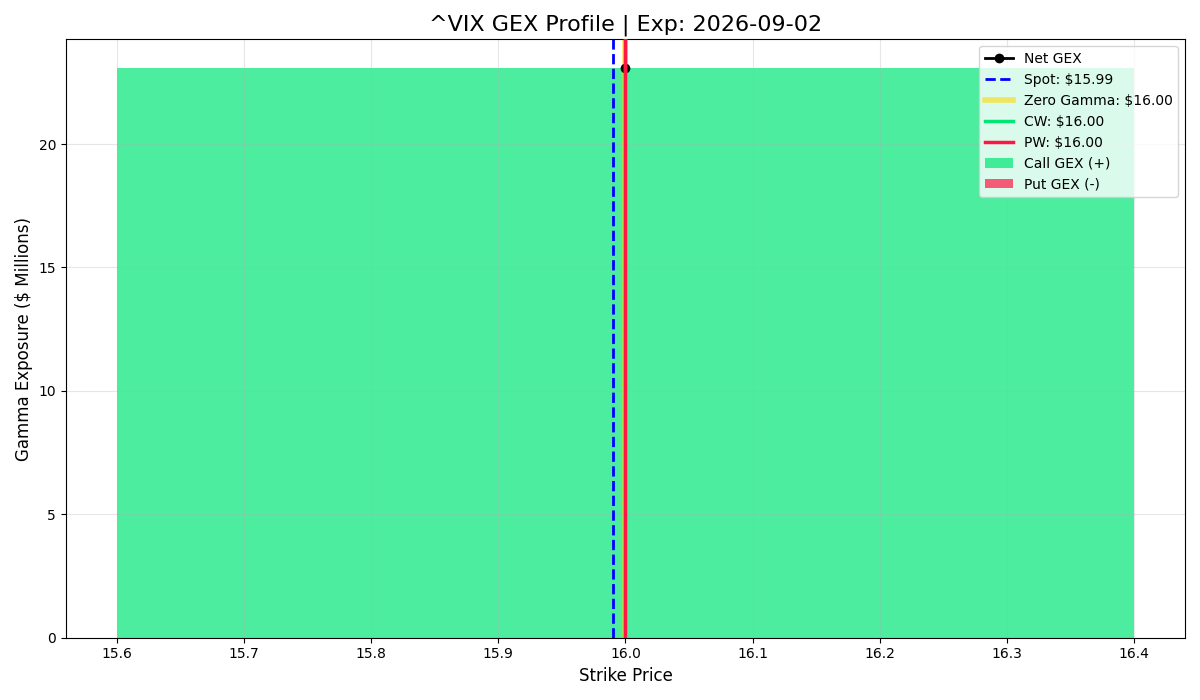
AAL
- Current Price: $154.87
- Call Wall (Resistance): $15.00
- Put Wall (Support): $15.00
- Market Regime: Positive (Dealers Suppressing Volatility)
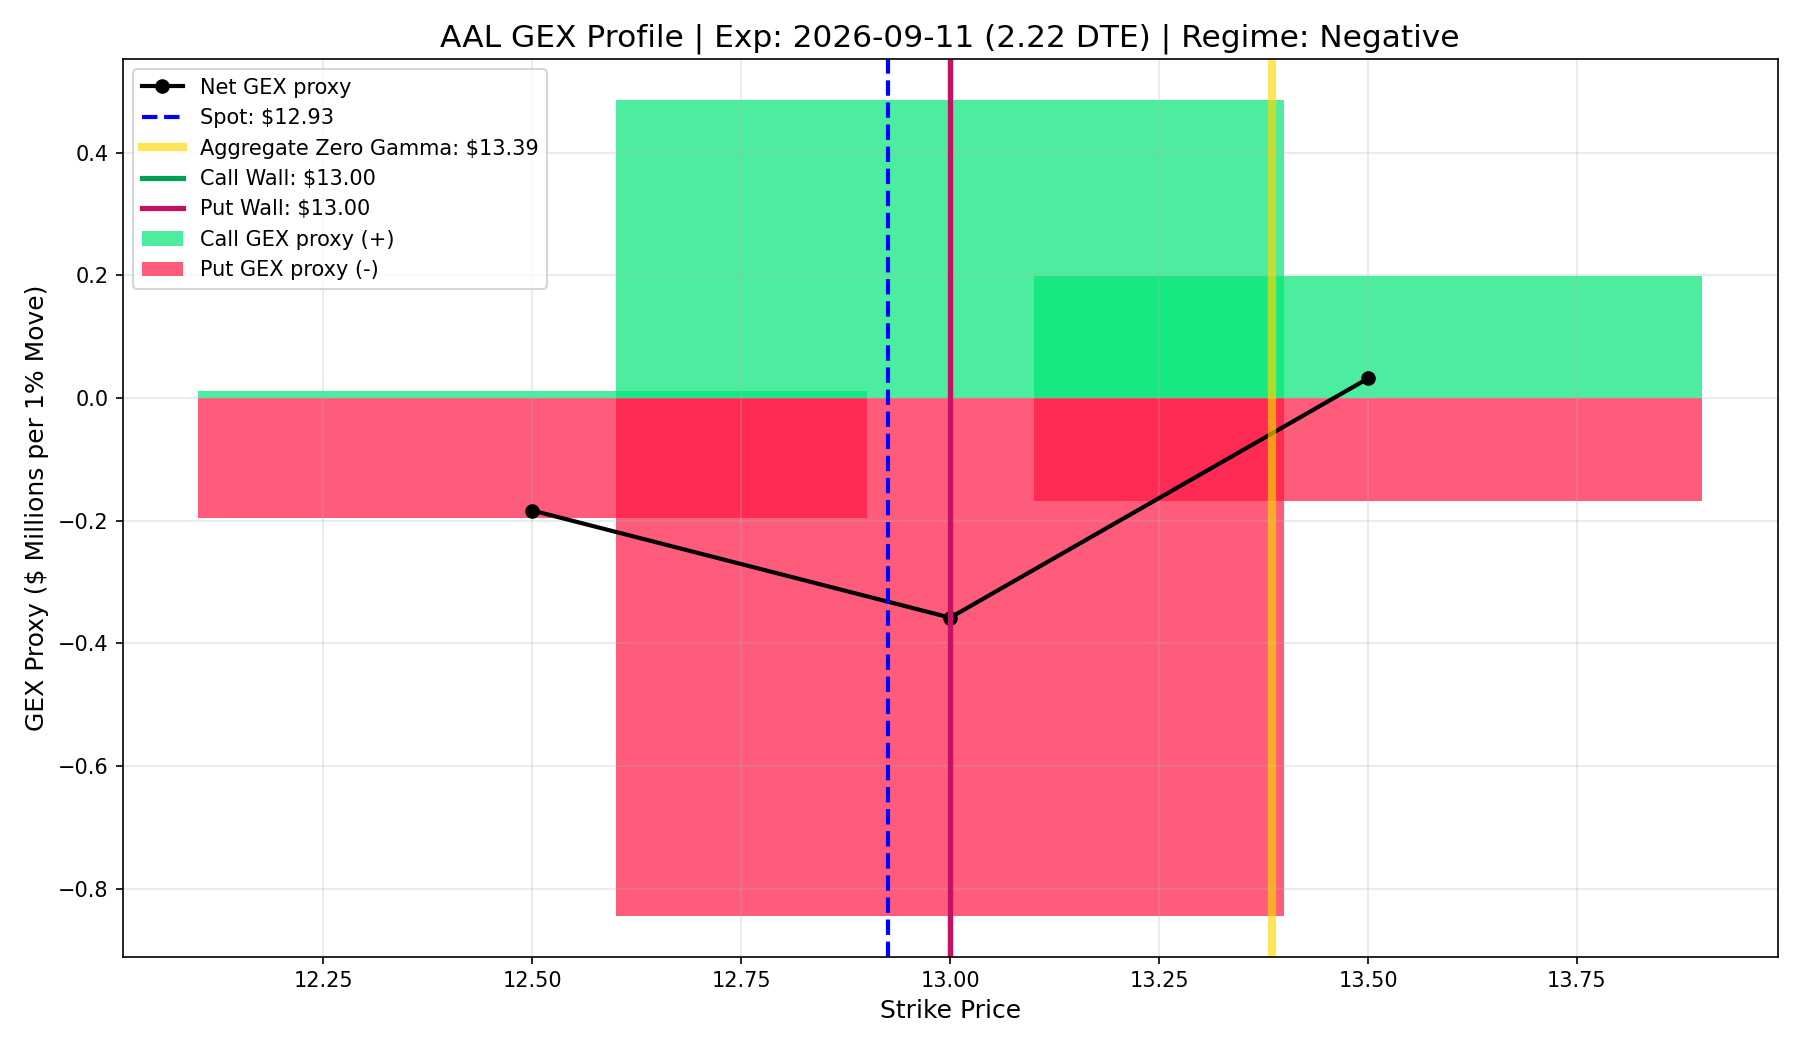
AAPL
- Current Price: $154.87
- Call Wall (Resistance): $337.50
- Put Wall (Support): $337.50
- Market Regime: Positive (Dealers Suppressing Volatility)
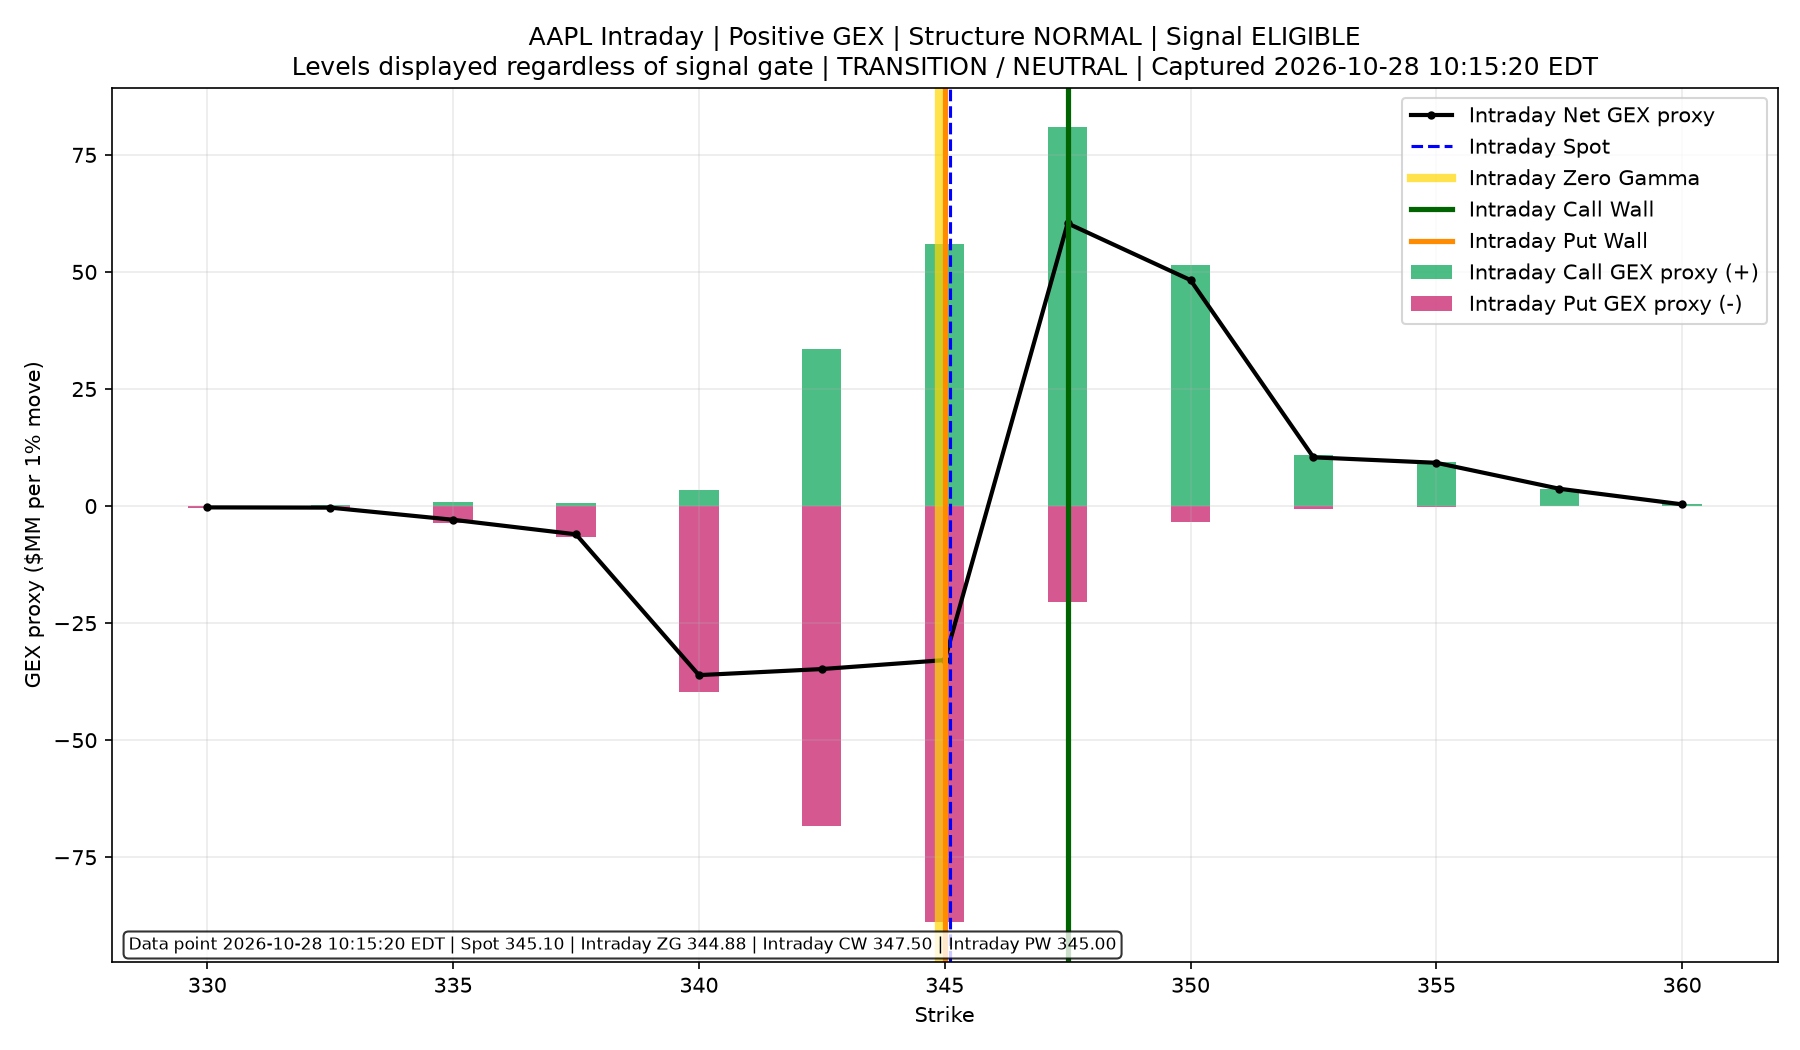
ABT
- Current Price: $154.87
- Call Wall (Resistance): $105.00
- Put Wall (Support): $103.00
- Market Regime: Positive (Dealers Suppressing Volatility)
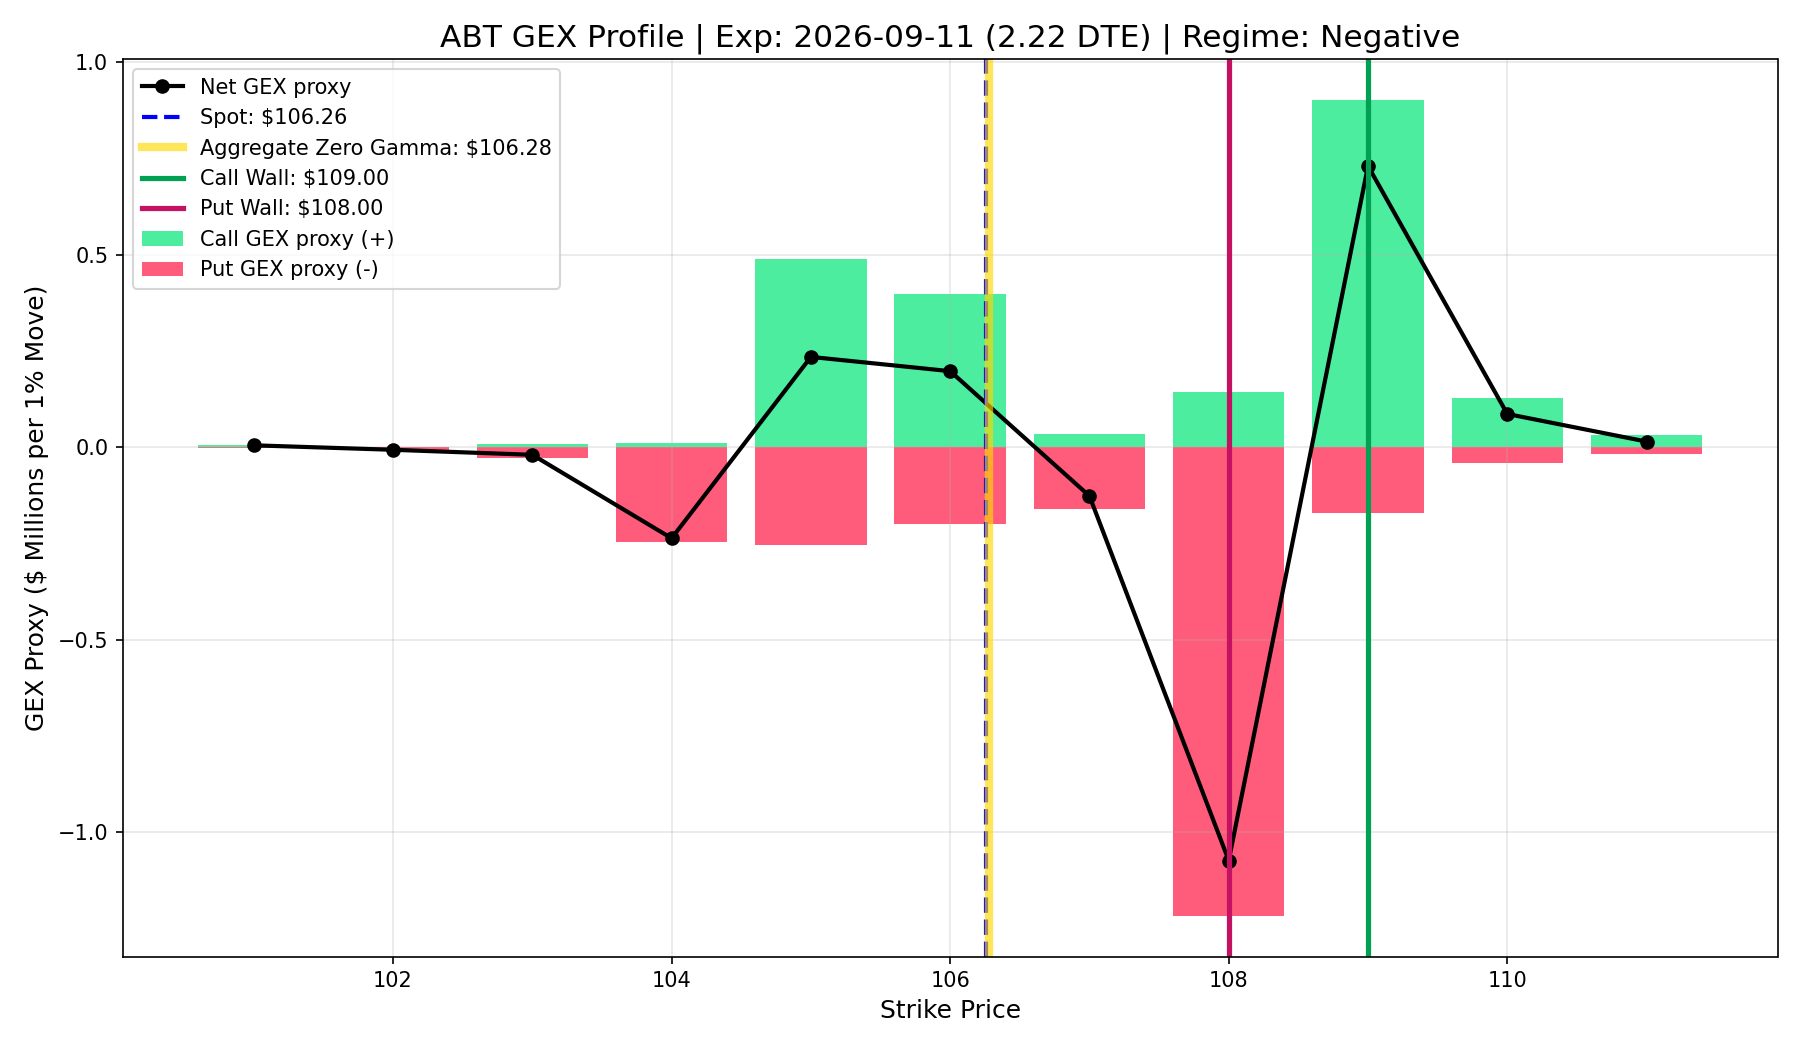
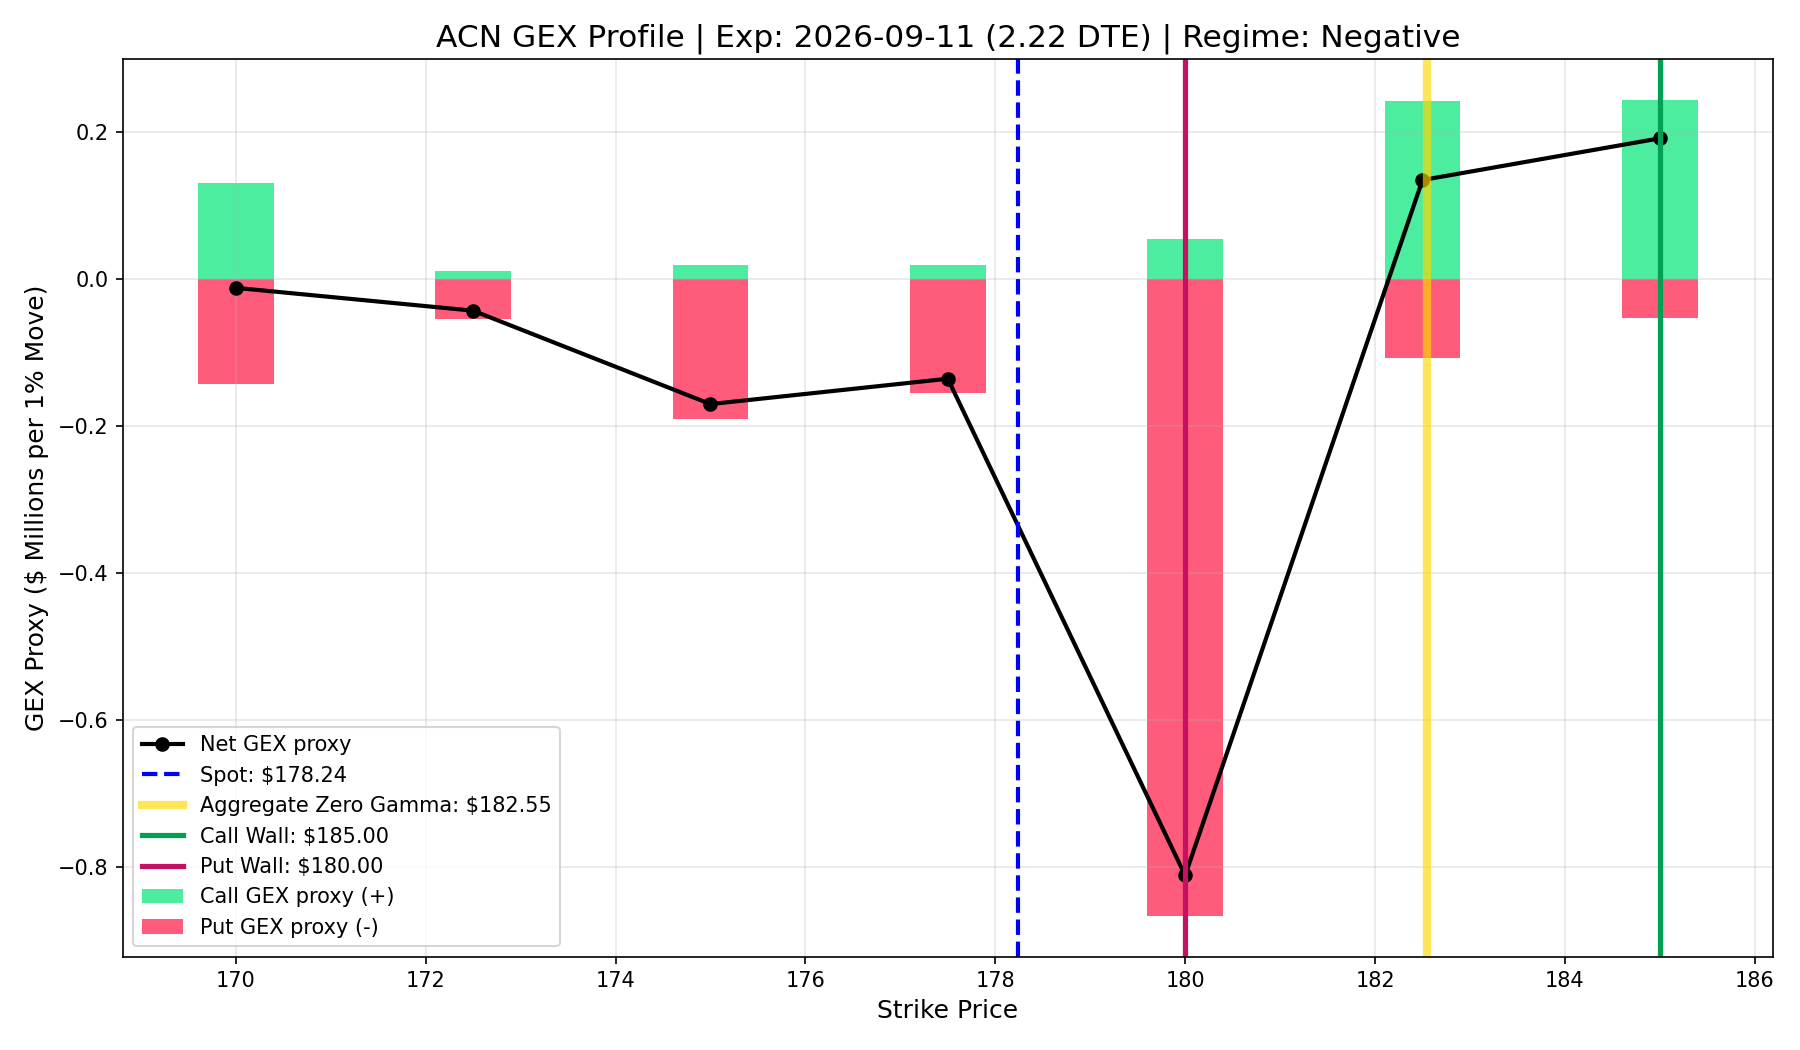
ACN
- Current Price: $154.87
- Call Wall (Resistance): $152.50
- Put Wall (Support): $155.00
- Market Regime: Positive (Dealers Suppressing Volatility)
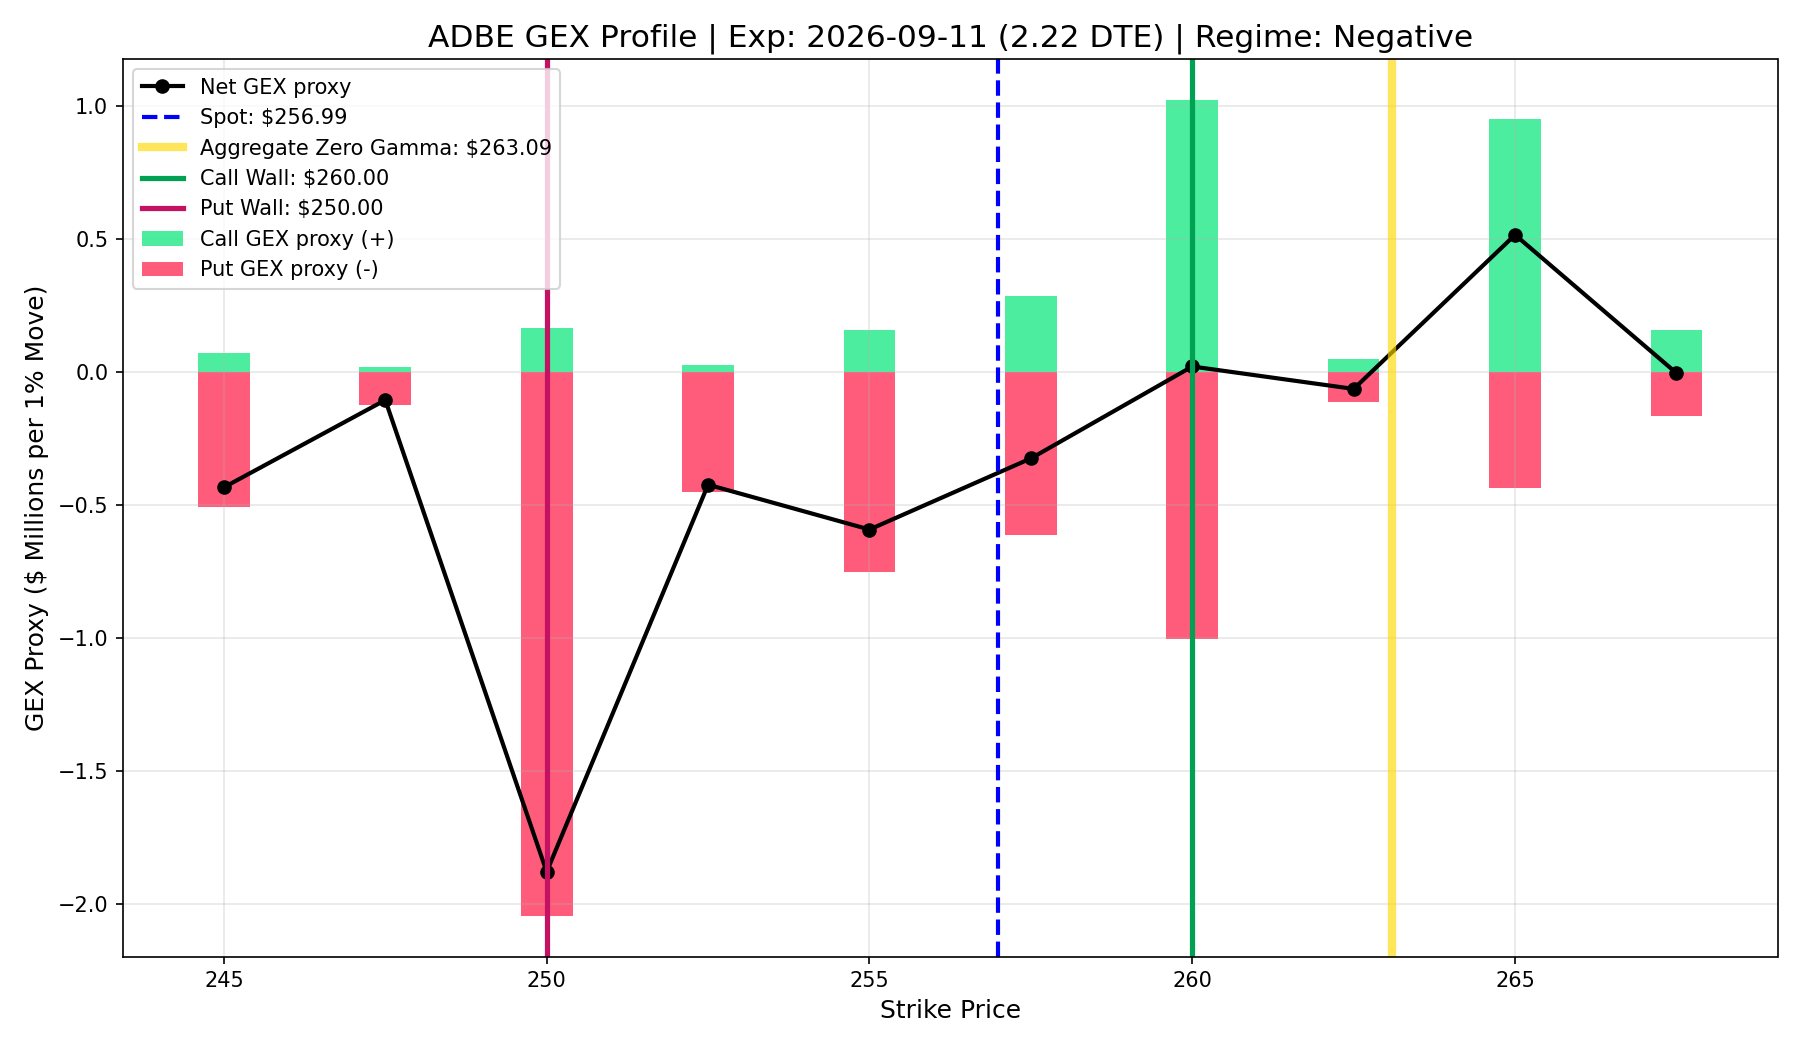
ADBE
- Current Price: $154.87
- Call Wall (Resistance): $240.00
- Put Wall (Support): $230.00
- Market Regime: Positive (Dealers Suppressing Volatility)
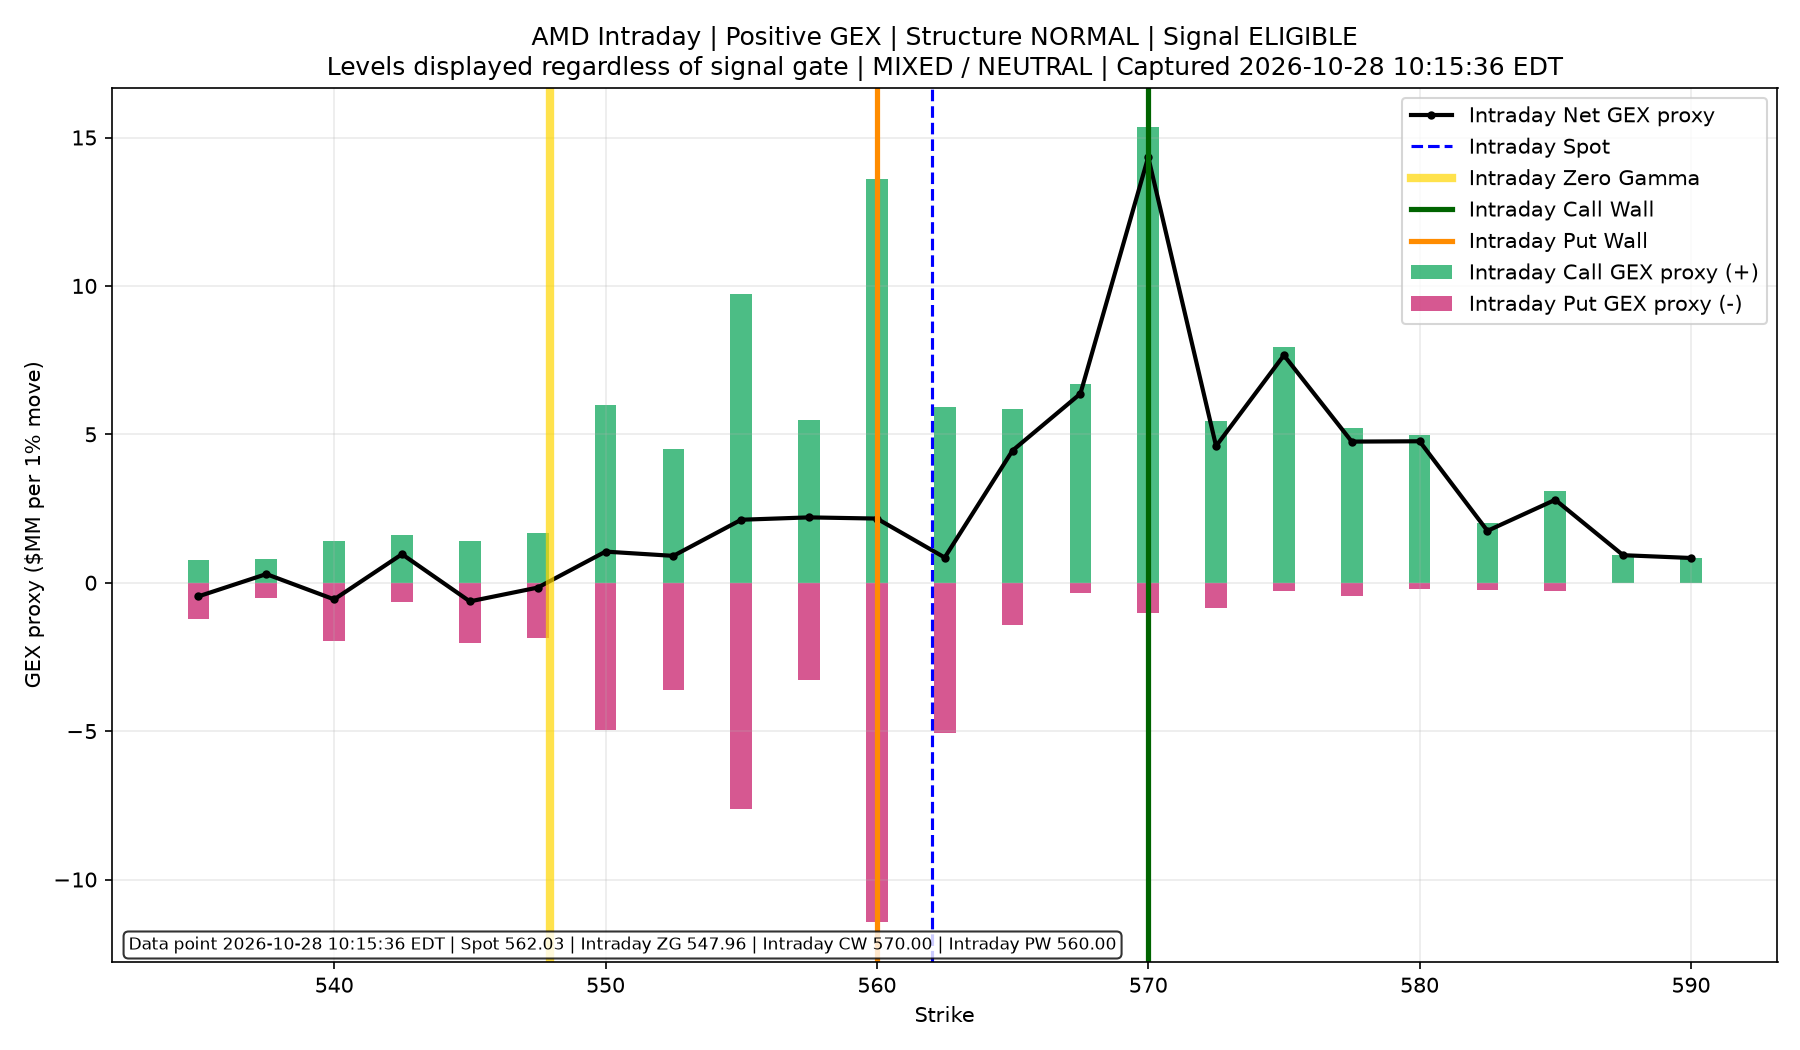
AMD
- Current Price: $154.87
- Call Wall (Resistance): $497.50
- Put Wall (Support): $500.00
- Market Regime: Negative (Dealers Amplifying Volatility)
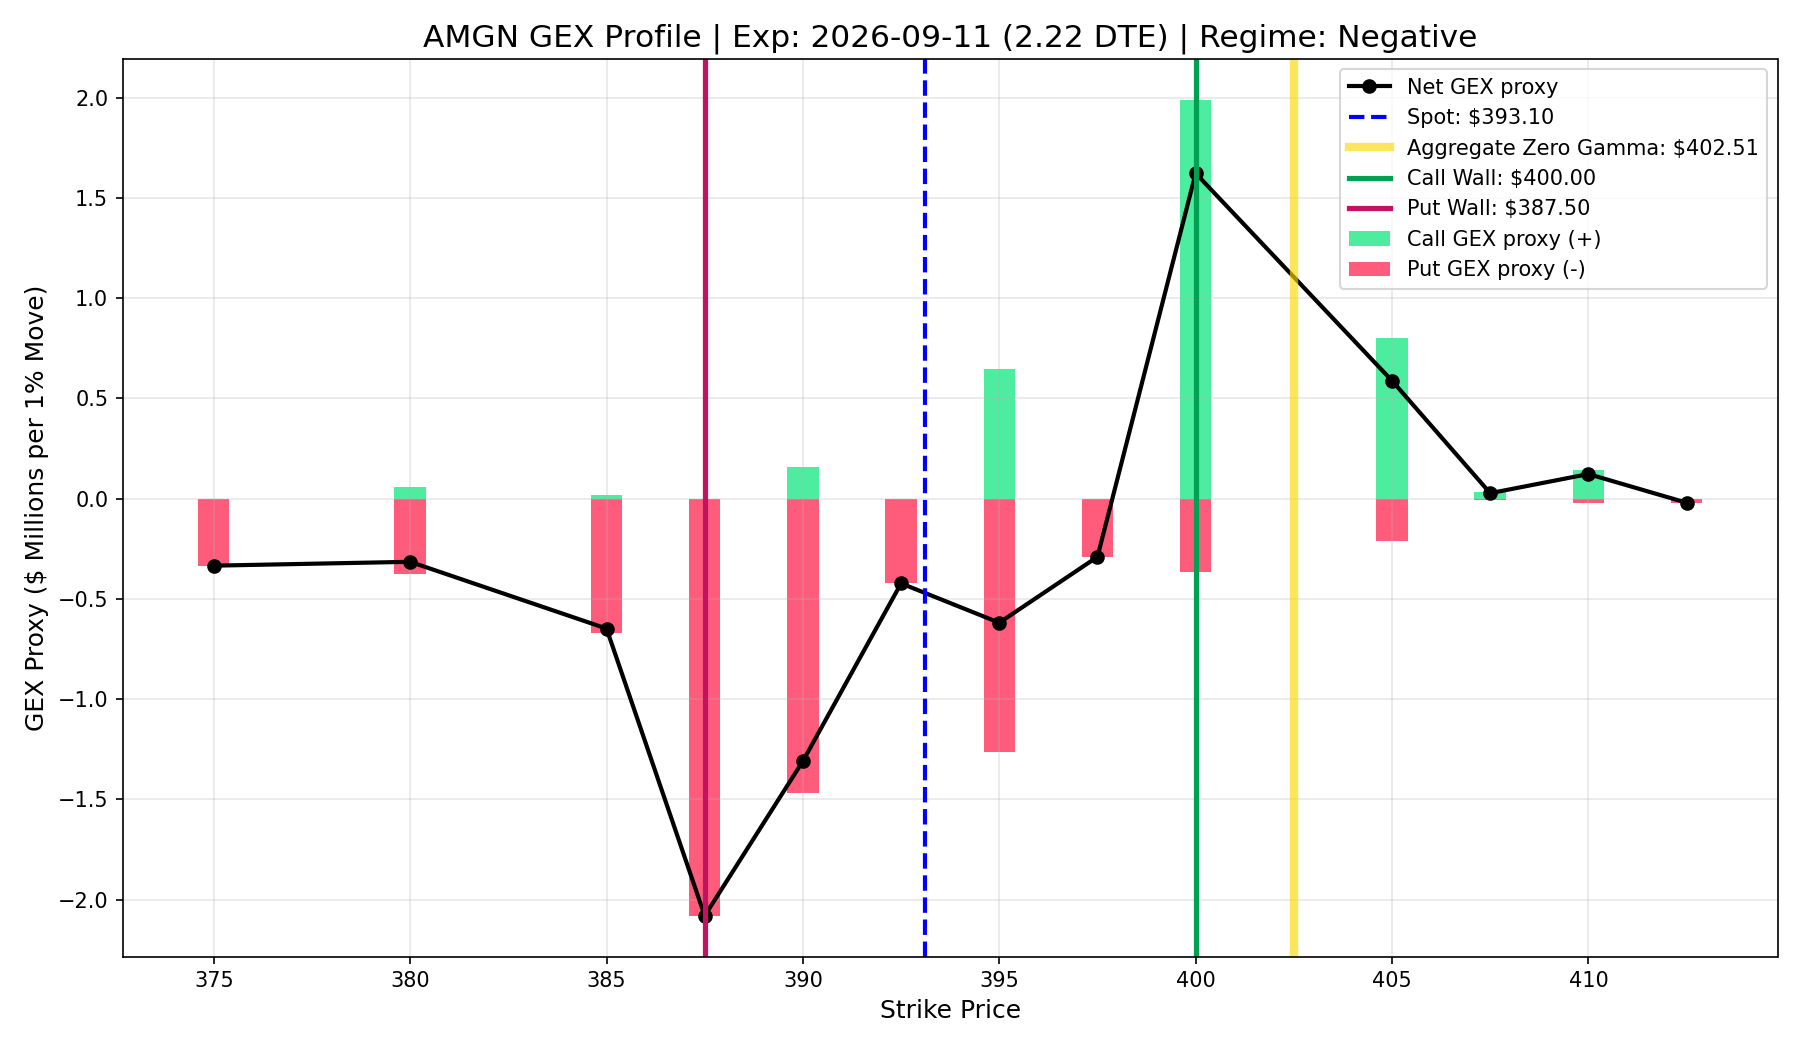
AMGN
- Current Price: $154.87
- Call Wall (Resistance): $375.00
- Put Wall (Support): $382.50
- Market Regime: Positive (Dealers Suppressing Volatility)
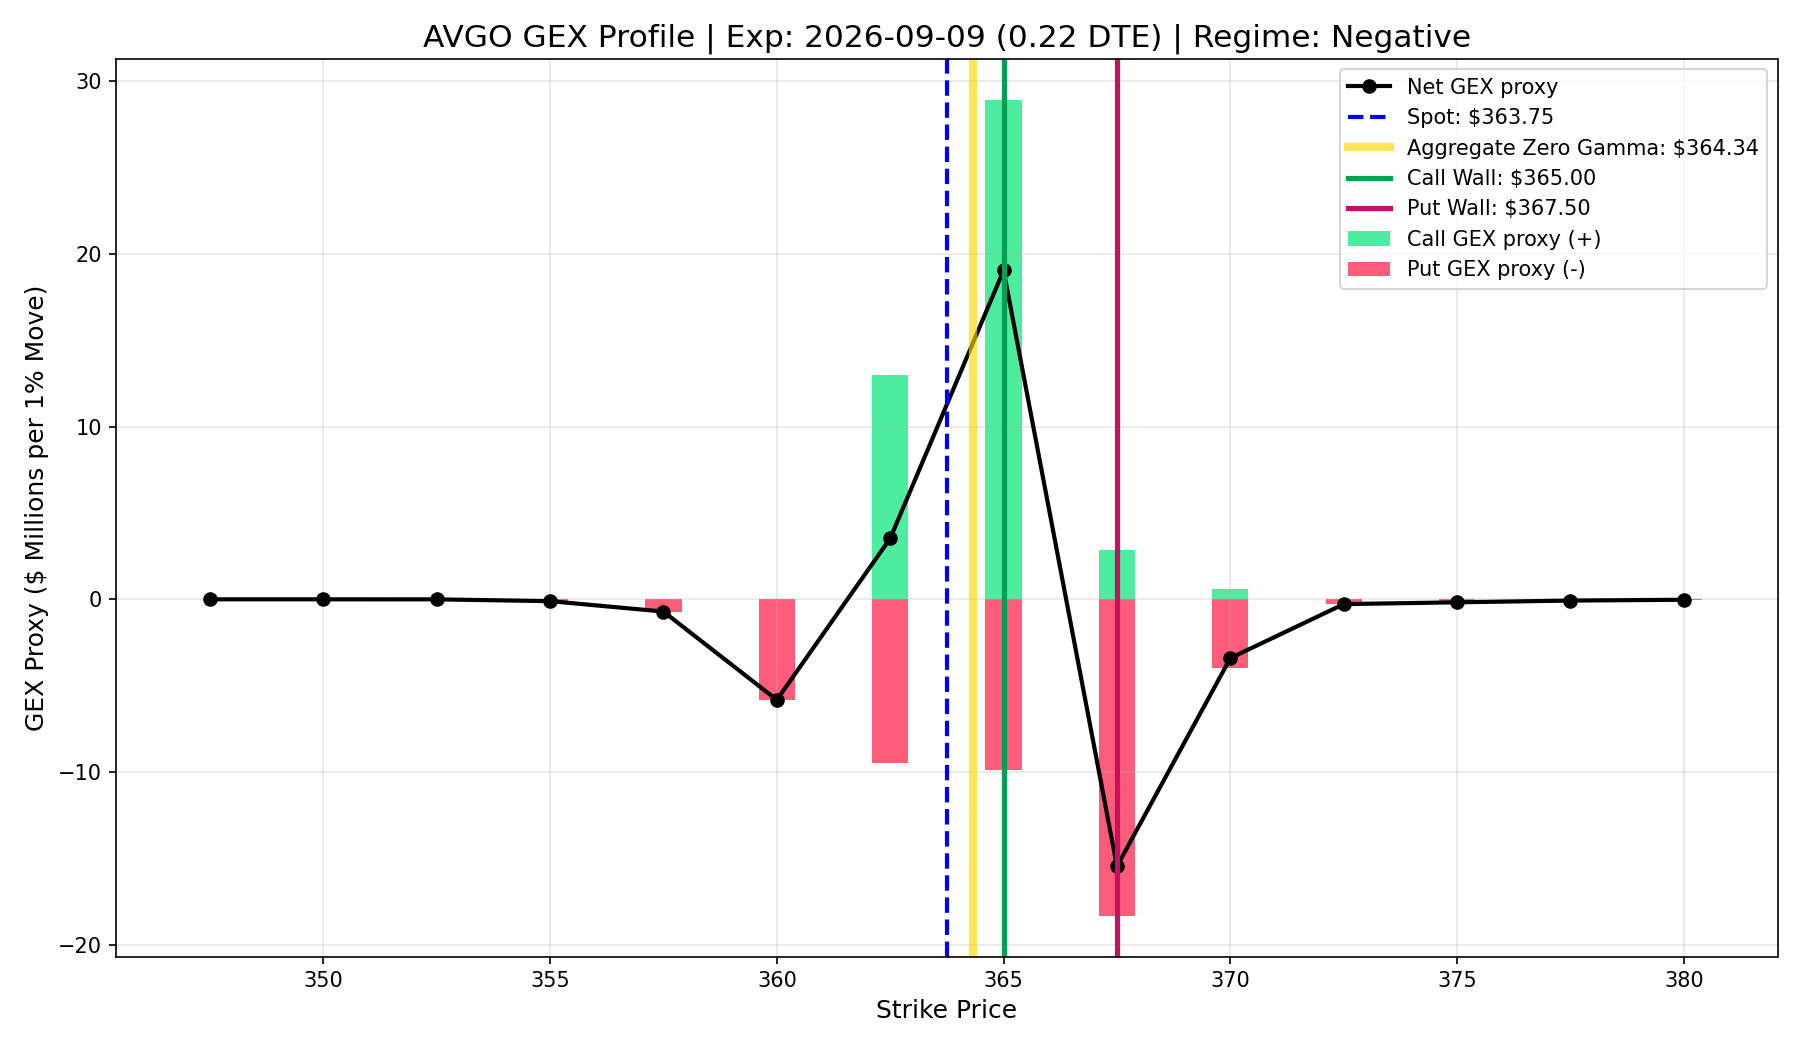
AVGO
- Current Price: $154.87
- Call Wall (Resistance): $382.50
- Put Wall (Support): $382.50
- Market Regime: Positive (Dealers Suppressing Volatility)
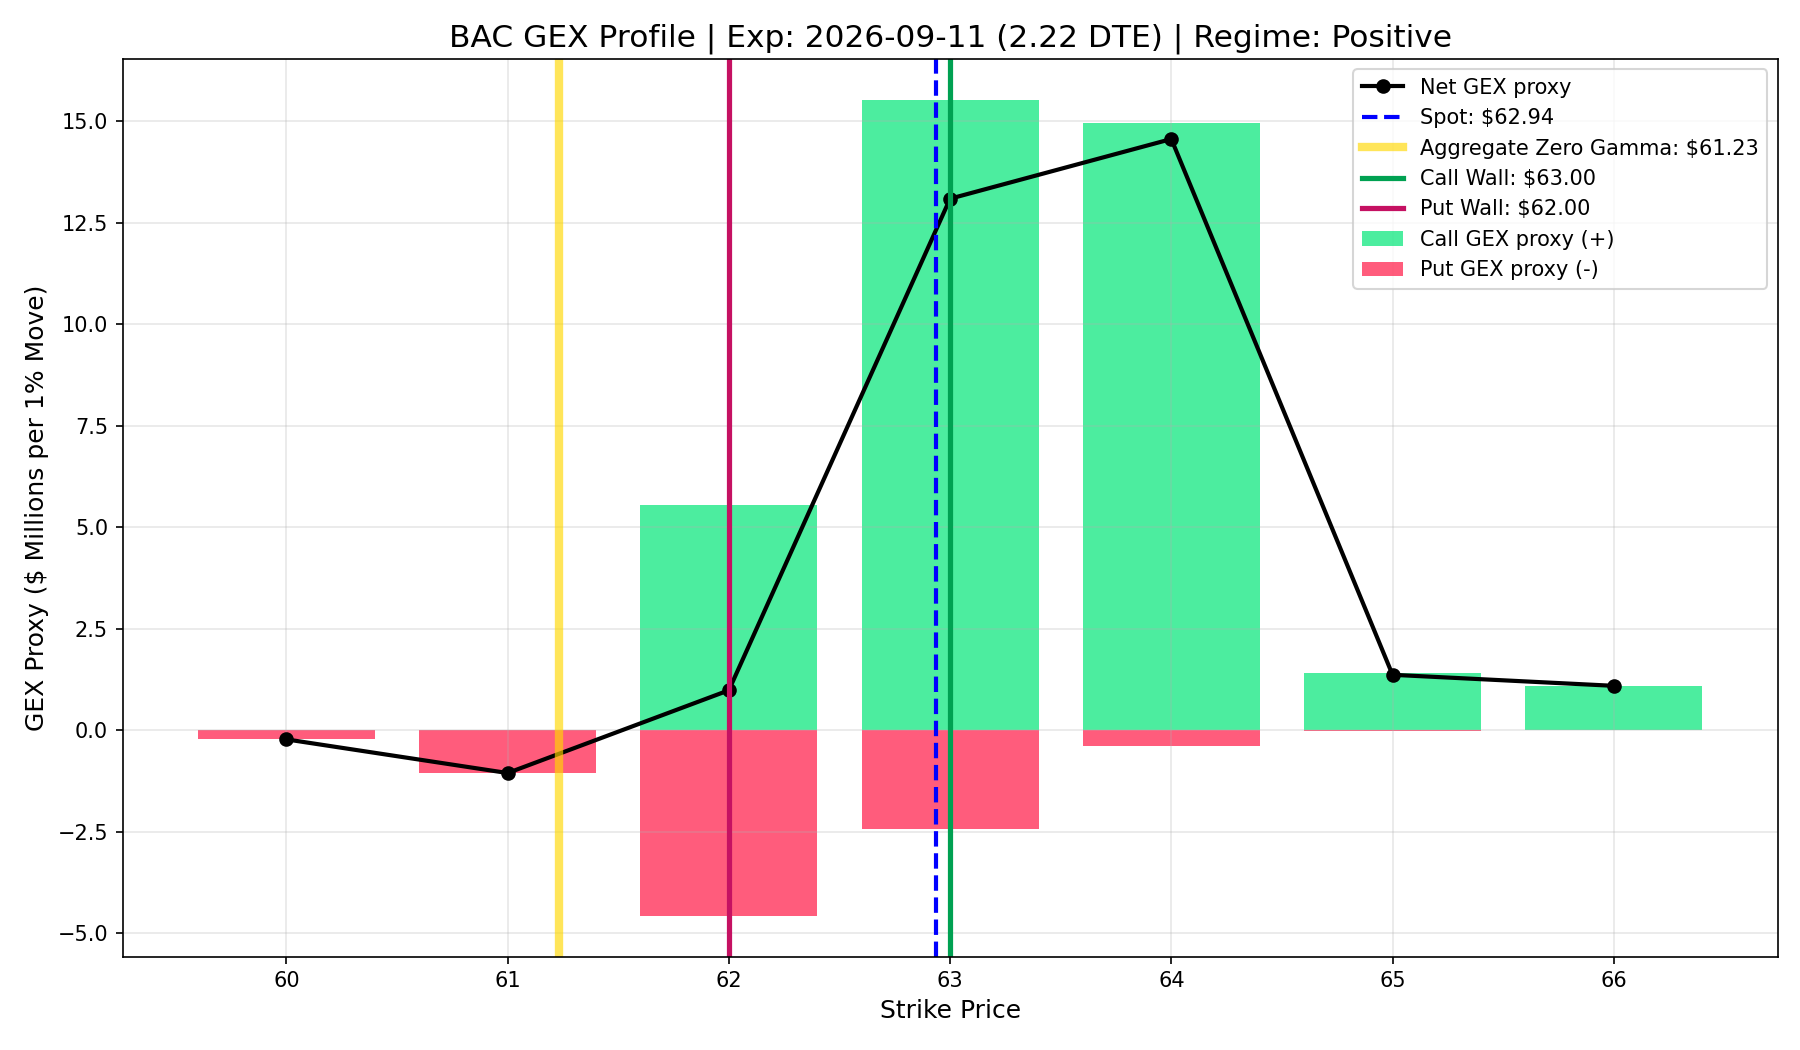
BAC
- Current Price: $154.87
- Call Wall (Resistance): $62.00
- Put Wall (Support): $60.00
- Market Regime: Positive (Dealers Suppressing Volatility)
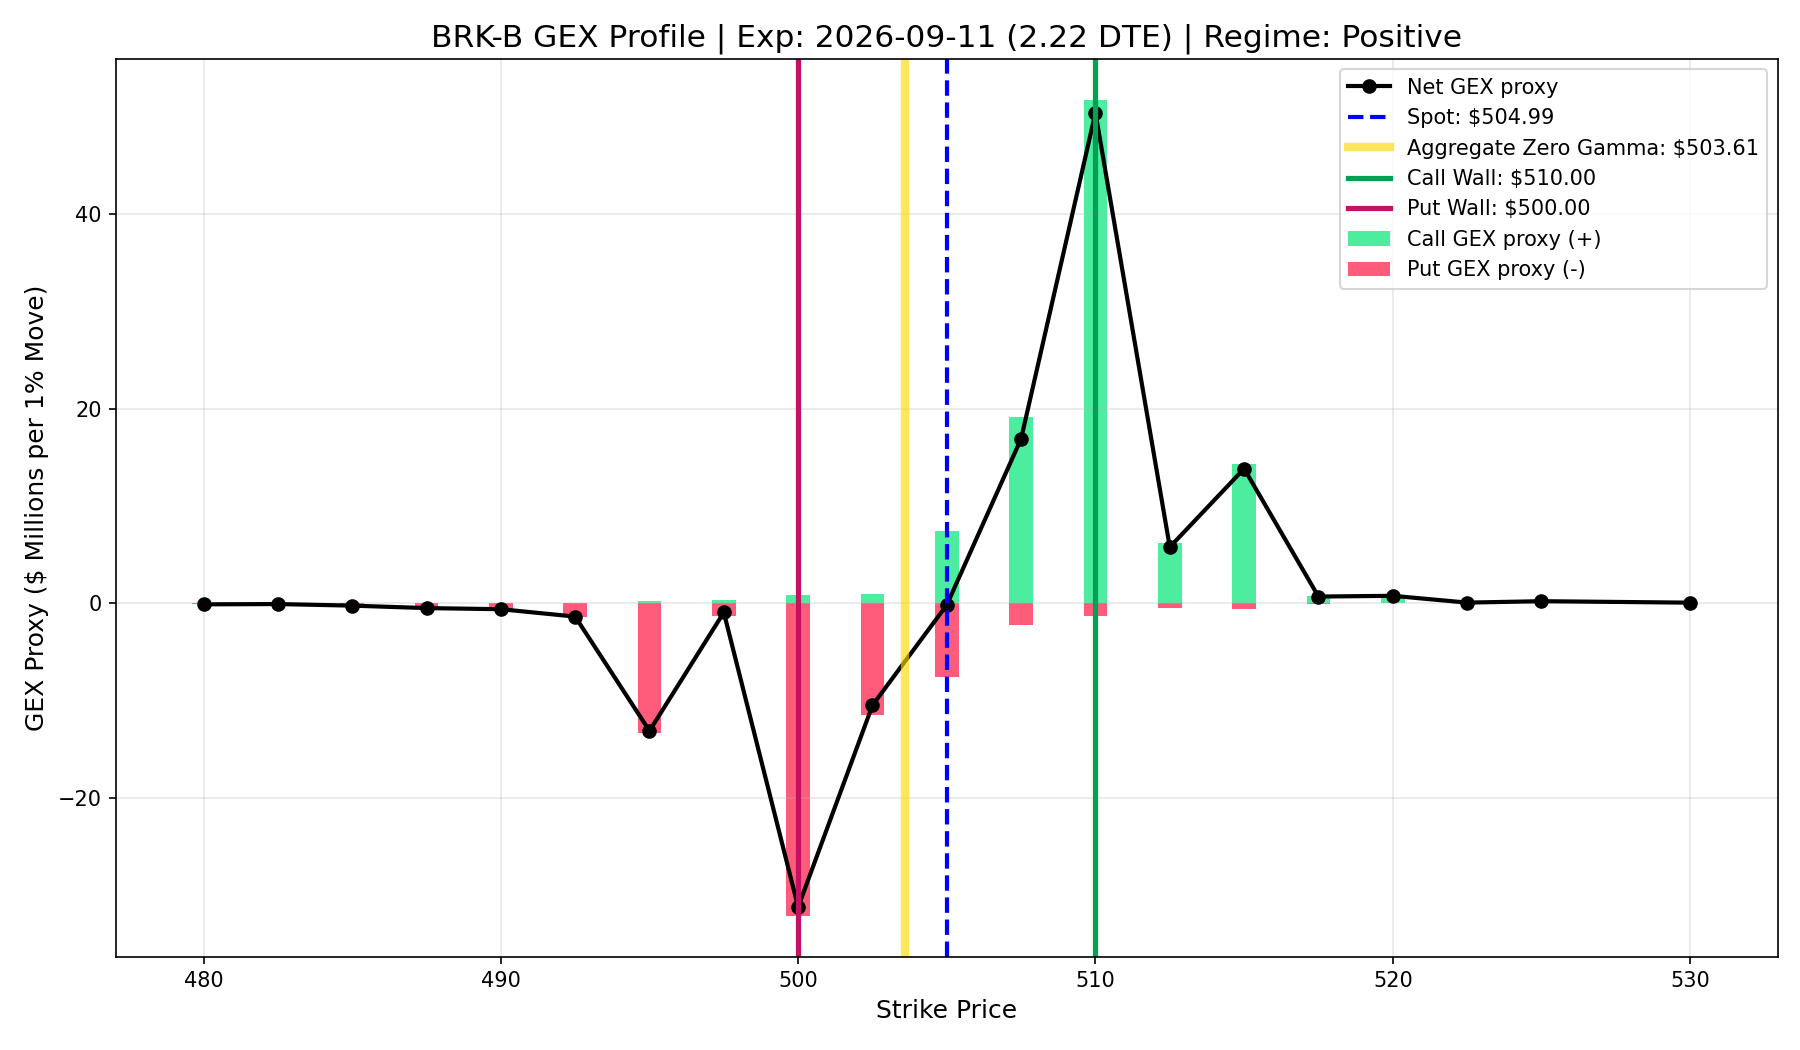
BRK-B
- Current Price: $154.87
- Call Wall (Resistance): $500.00
- Put Wall (Support): $490.00
- Market Regime: Positive (Dealers Suppressing Volatility)
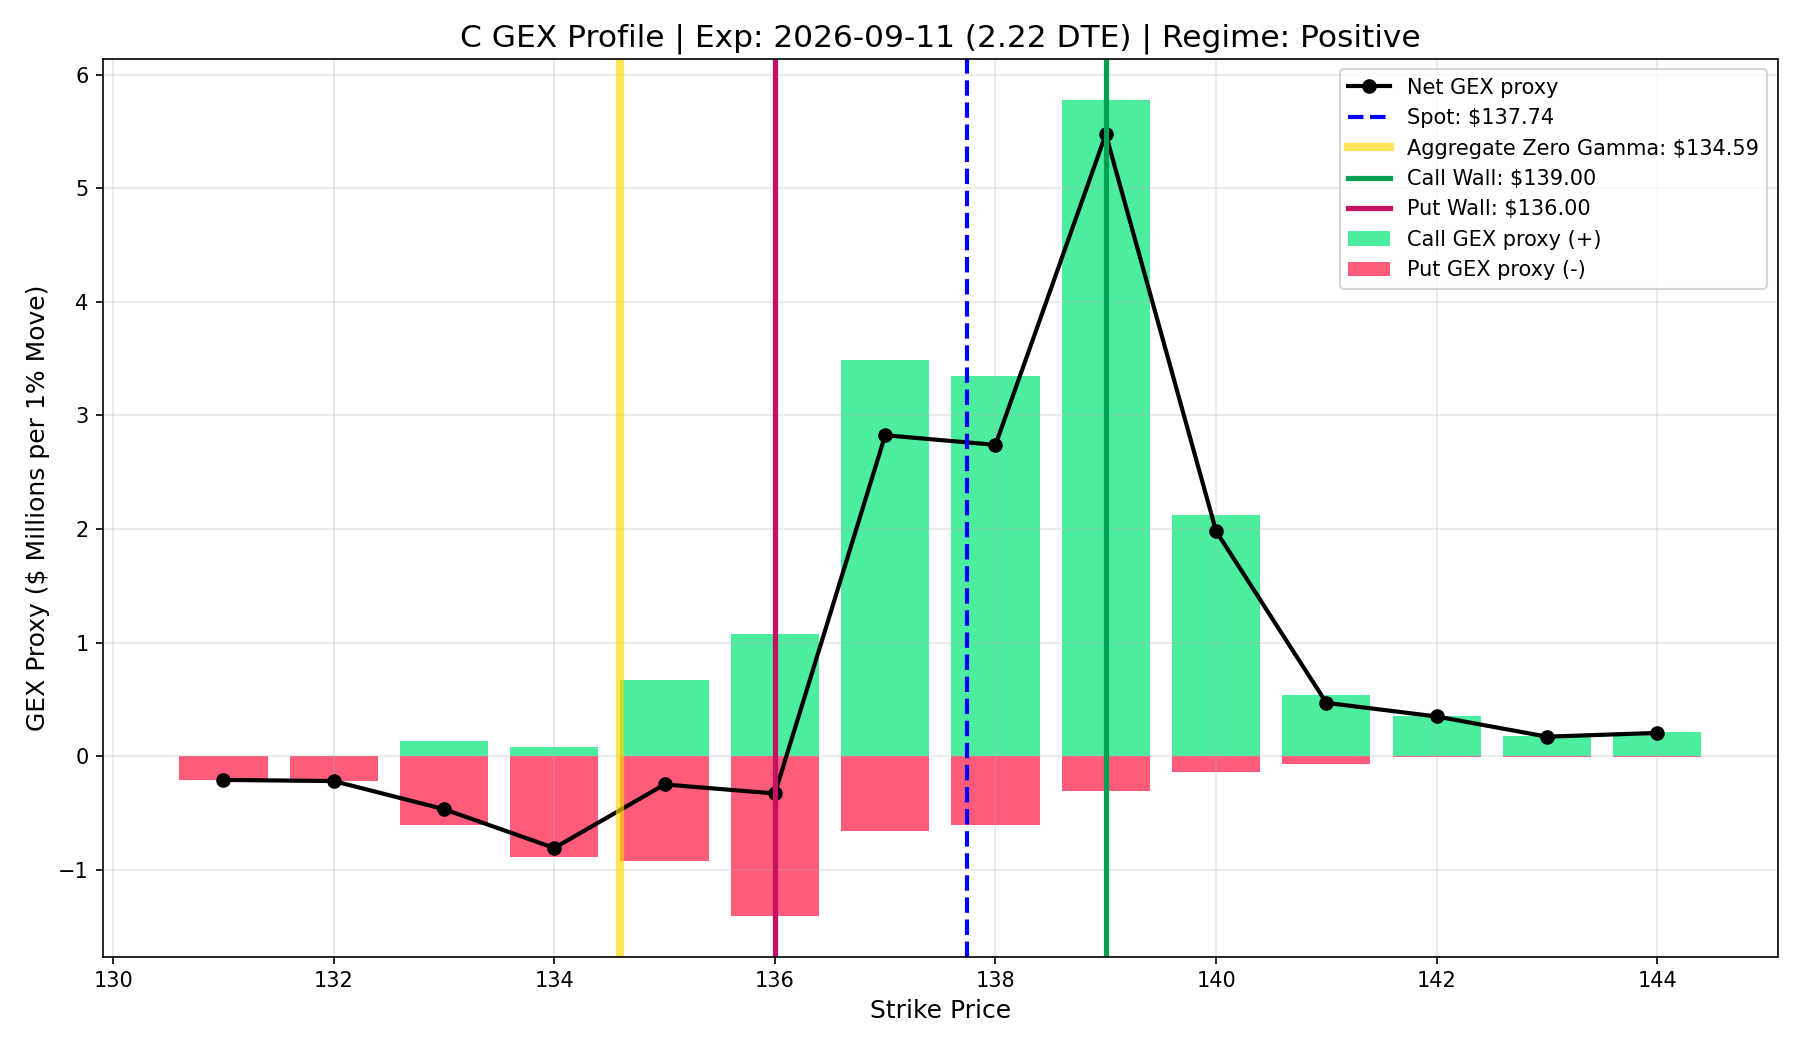
C
- Current Price: $154.87
- Call Wall (Resistance): $132.00
- Put Wall (Support): $130.00
- Market Regime: Negative (Dealers Amplifying Volatility)
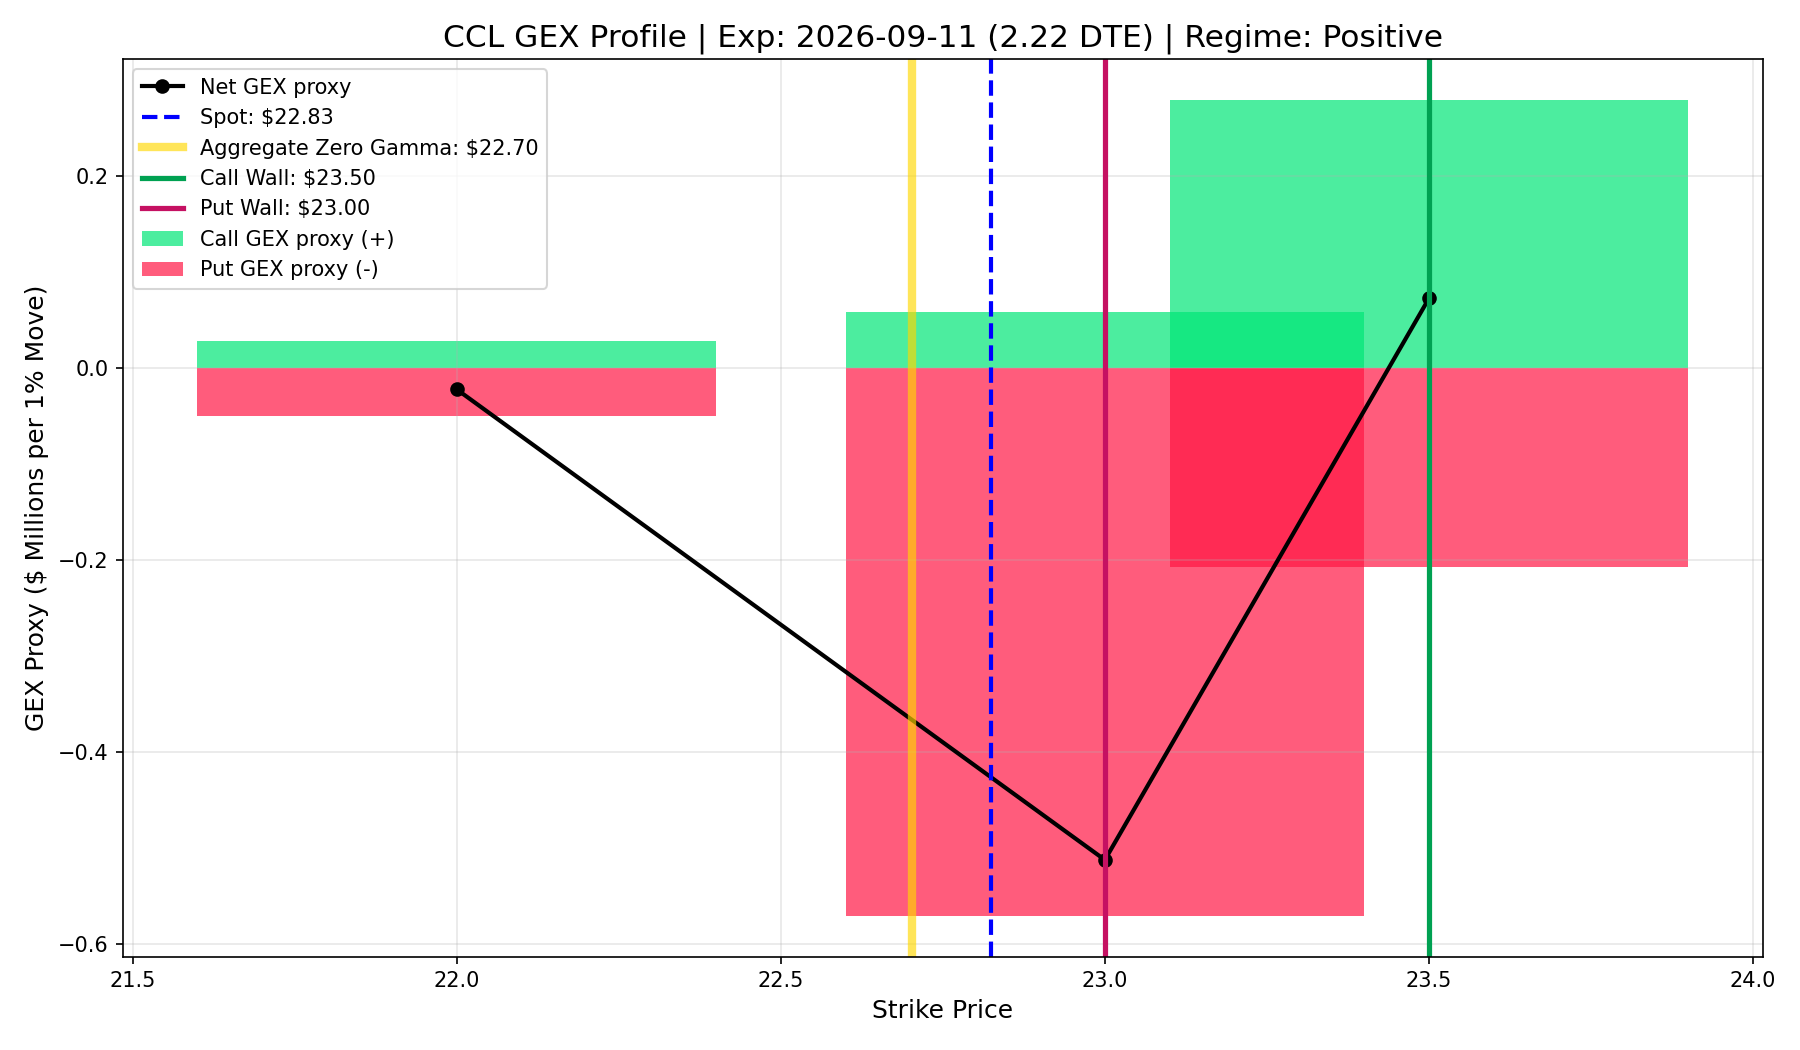
CCL
- Current Price: $154.87
- Call Wall (Resistance): $27.00
- Put Wall (Support): $27.00
- Market Regime: Positive (Dealers Suppressing Volatility)
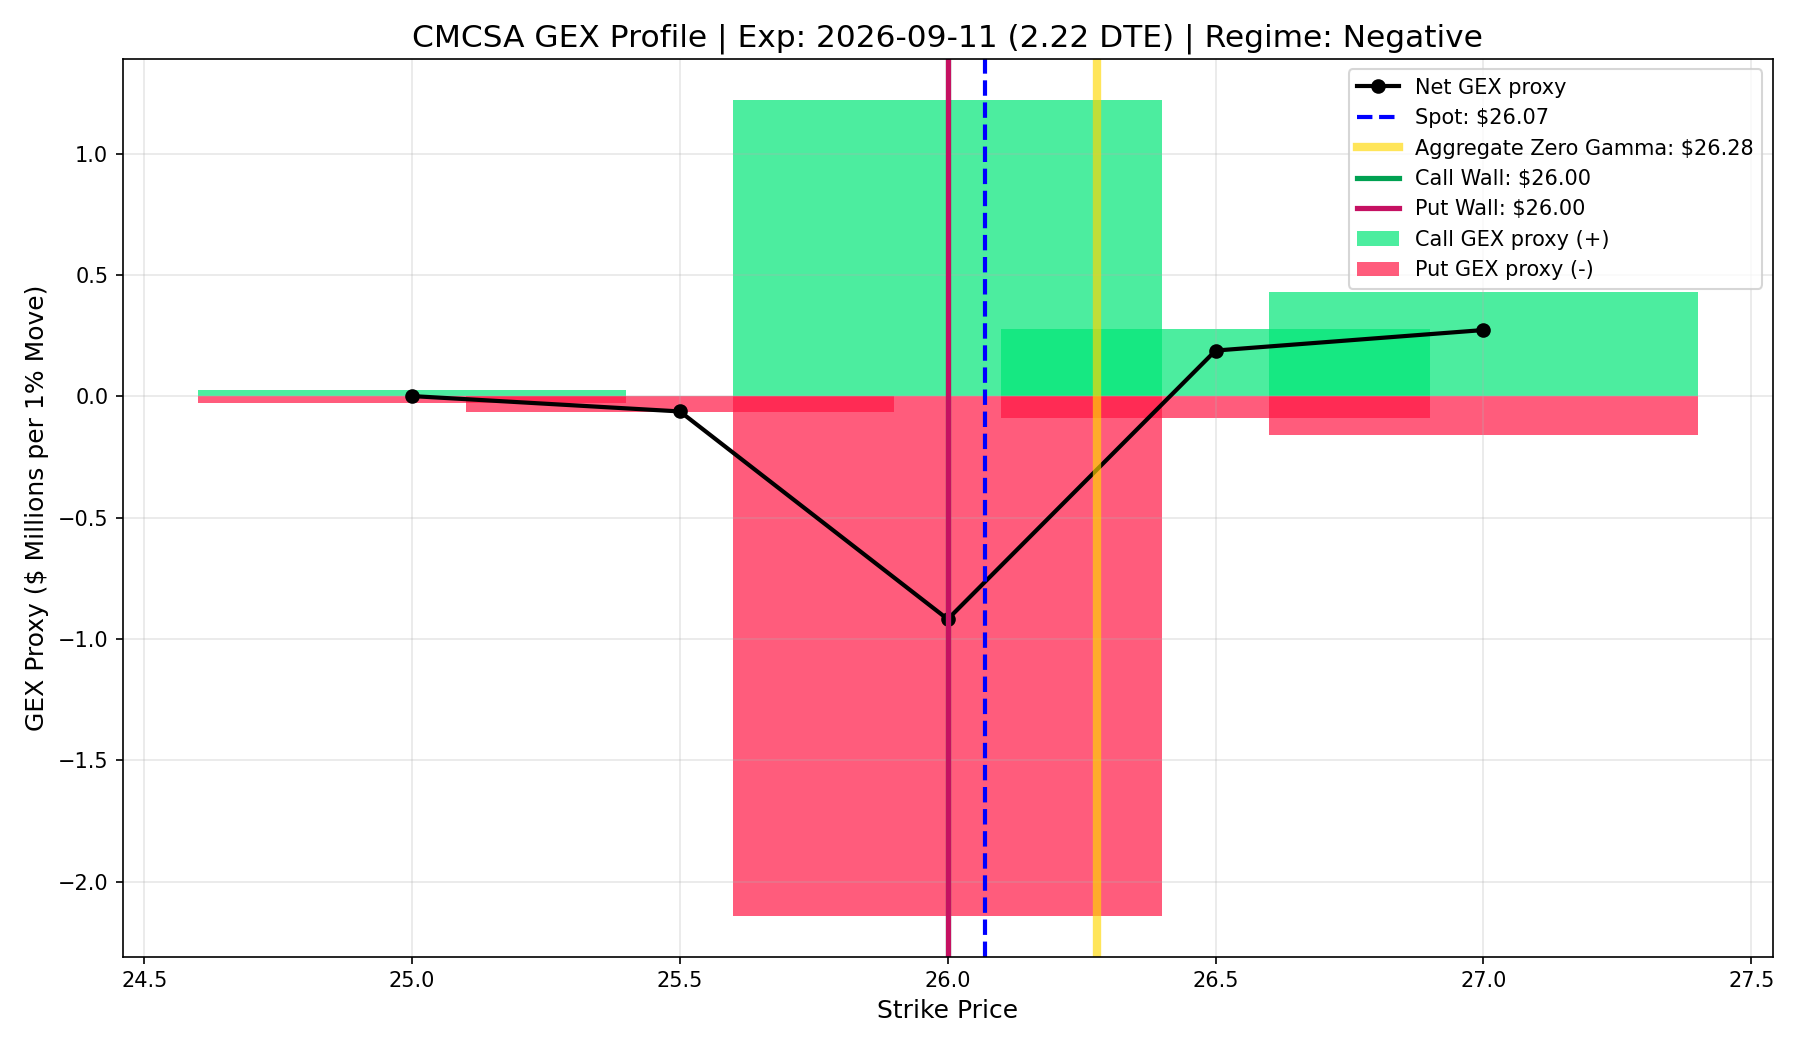
CMCSA
- Current Price: $154.87
- Call Wall (Resistance): $23.00
- Put Wall (Support): $22.50
- Market Regime: Negative (Dealers Amplifying Volatility)
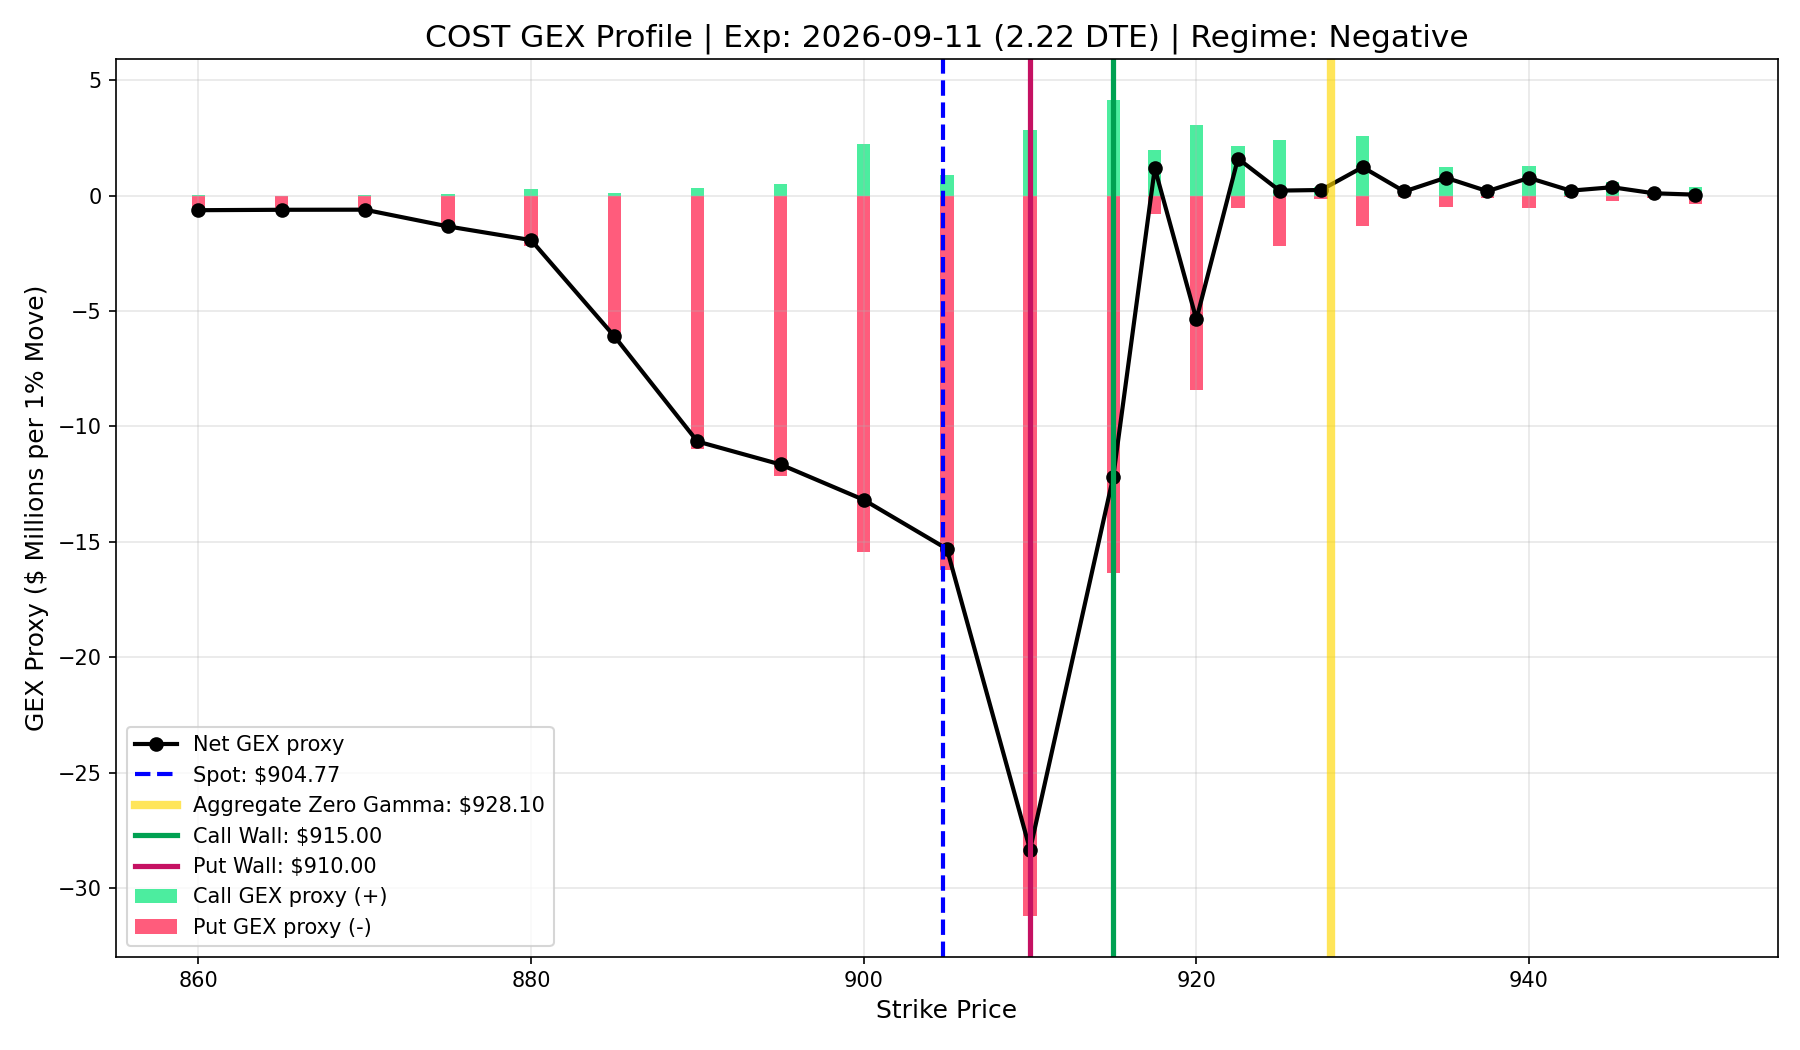
COST
- Current Price: $154.87
- Call Wall (Resistance): $940.00
- Put Wall (Support): $930.00
- Market Regime: Positive (Dealers Suppressing Volatility)
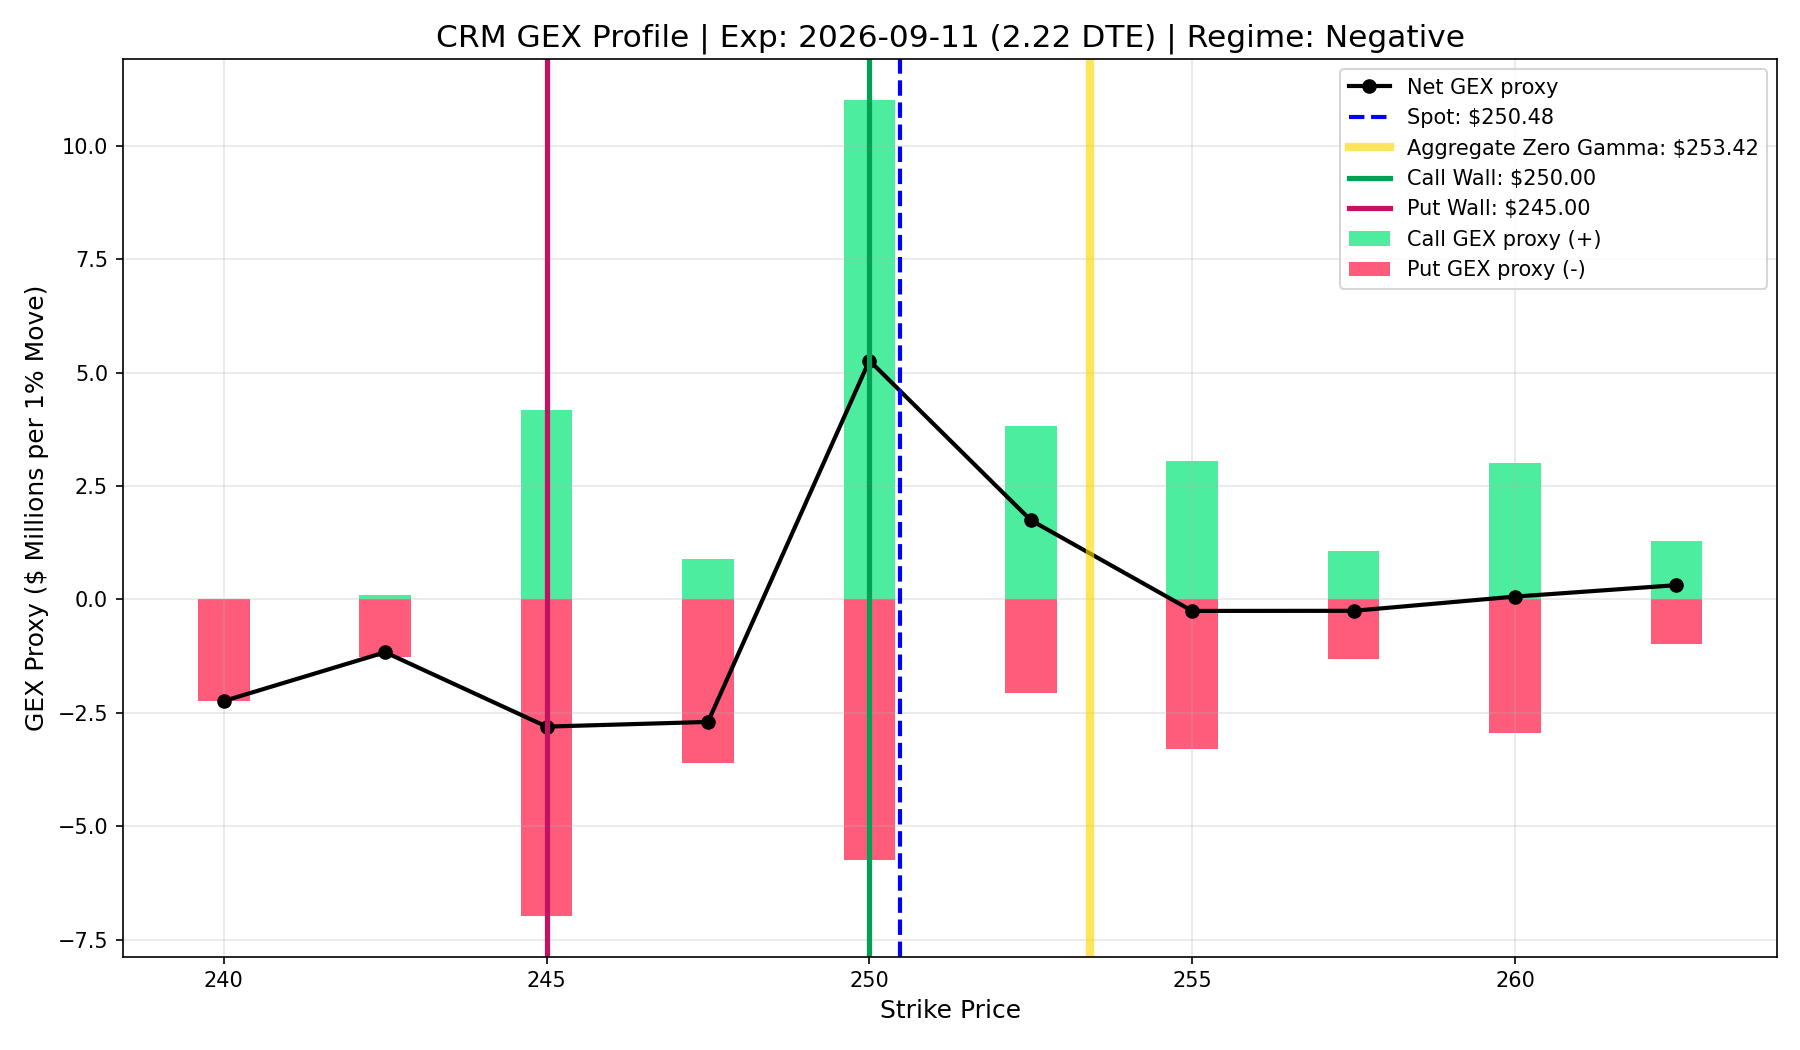
CRM
- Current Price: $154.87
- Call Wall (Resistance): $170.00
- Put Wall (Support): $175.00
- Market Regime: Positive (Dealers Suppressing Volatility)
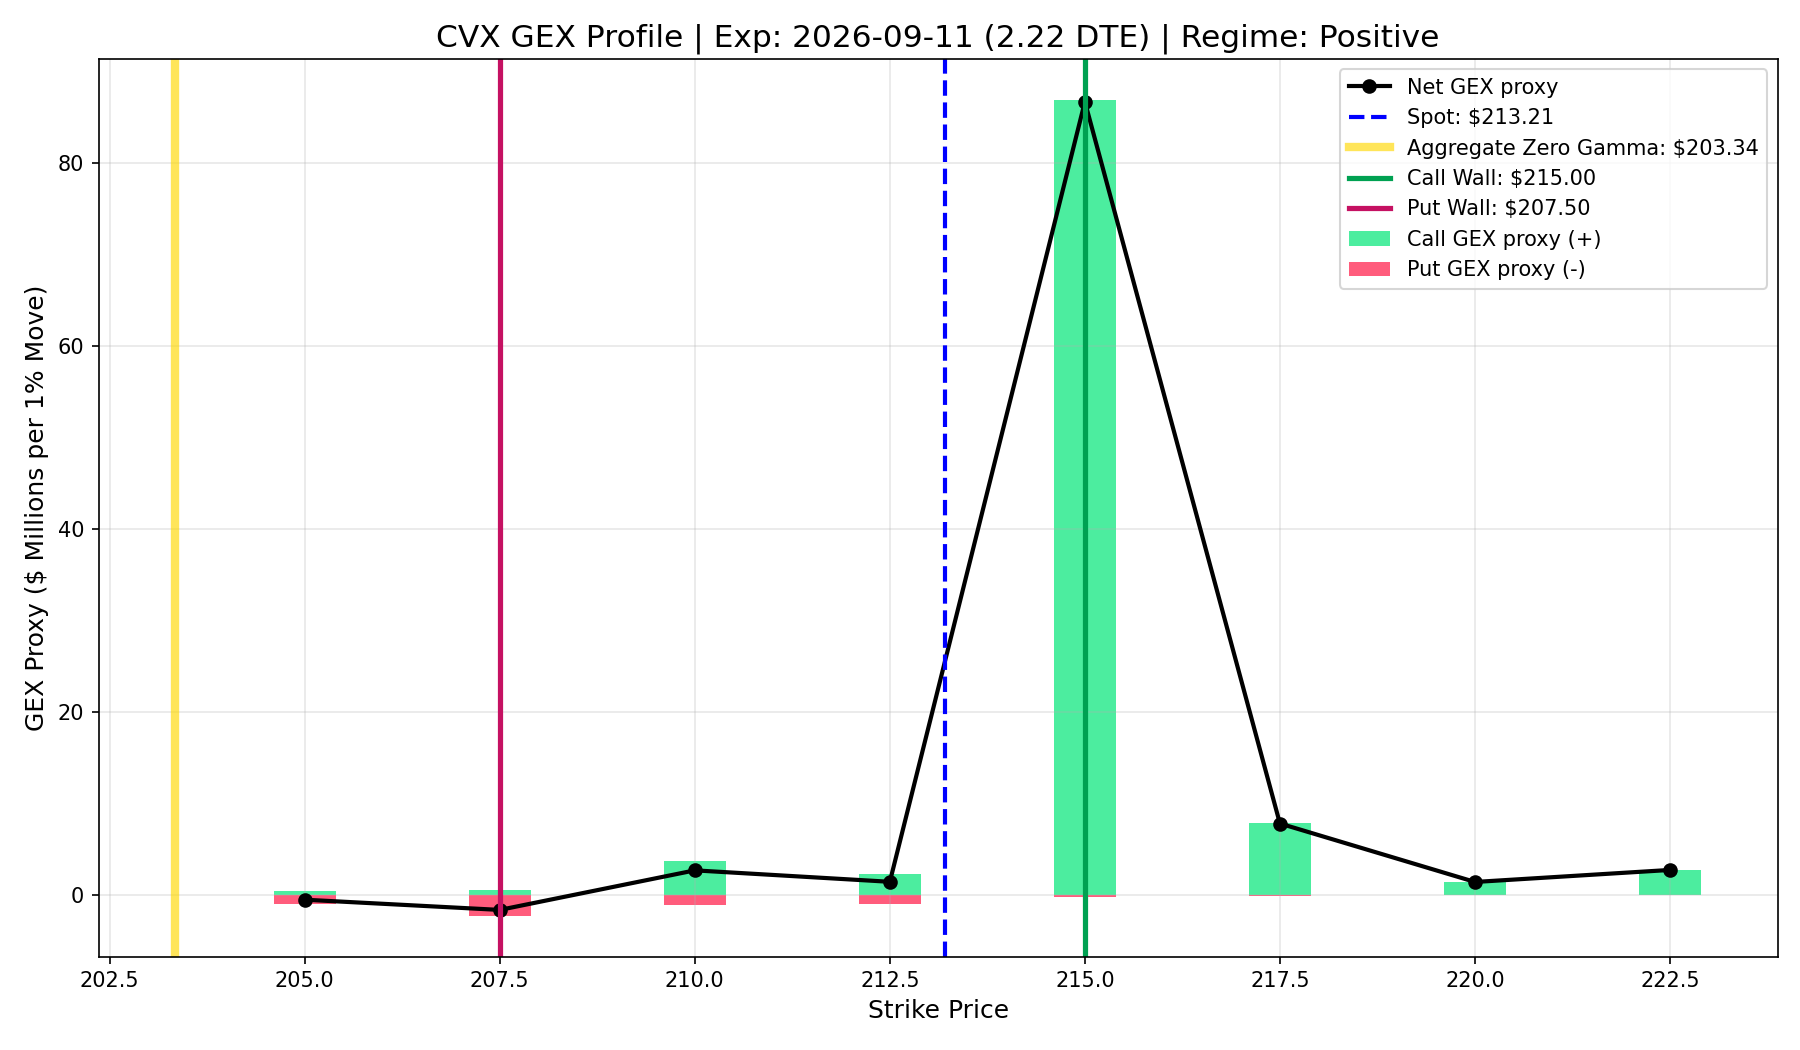
CVX
- Current Price: $154.87
- Call Wall (Resistance): $185.00
- Put Wall (Support): $187.50
- Market Regime: Positive (Dealers Suppressing Volatility)
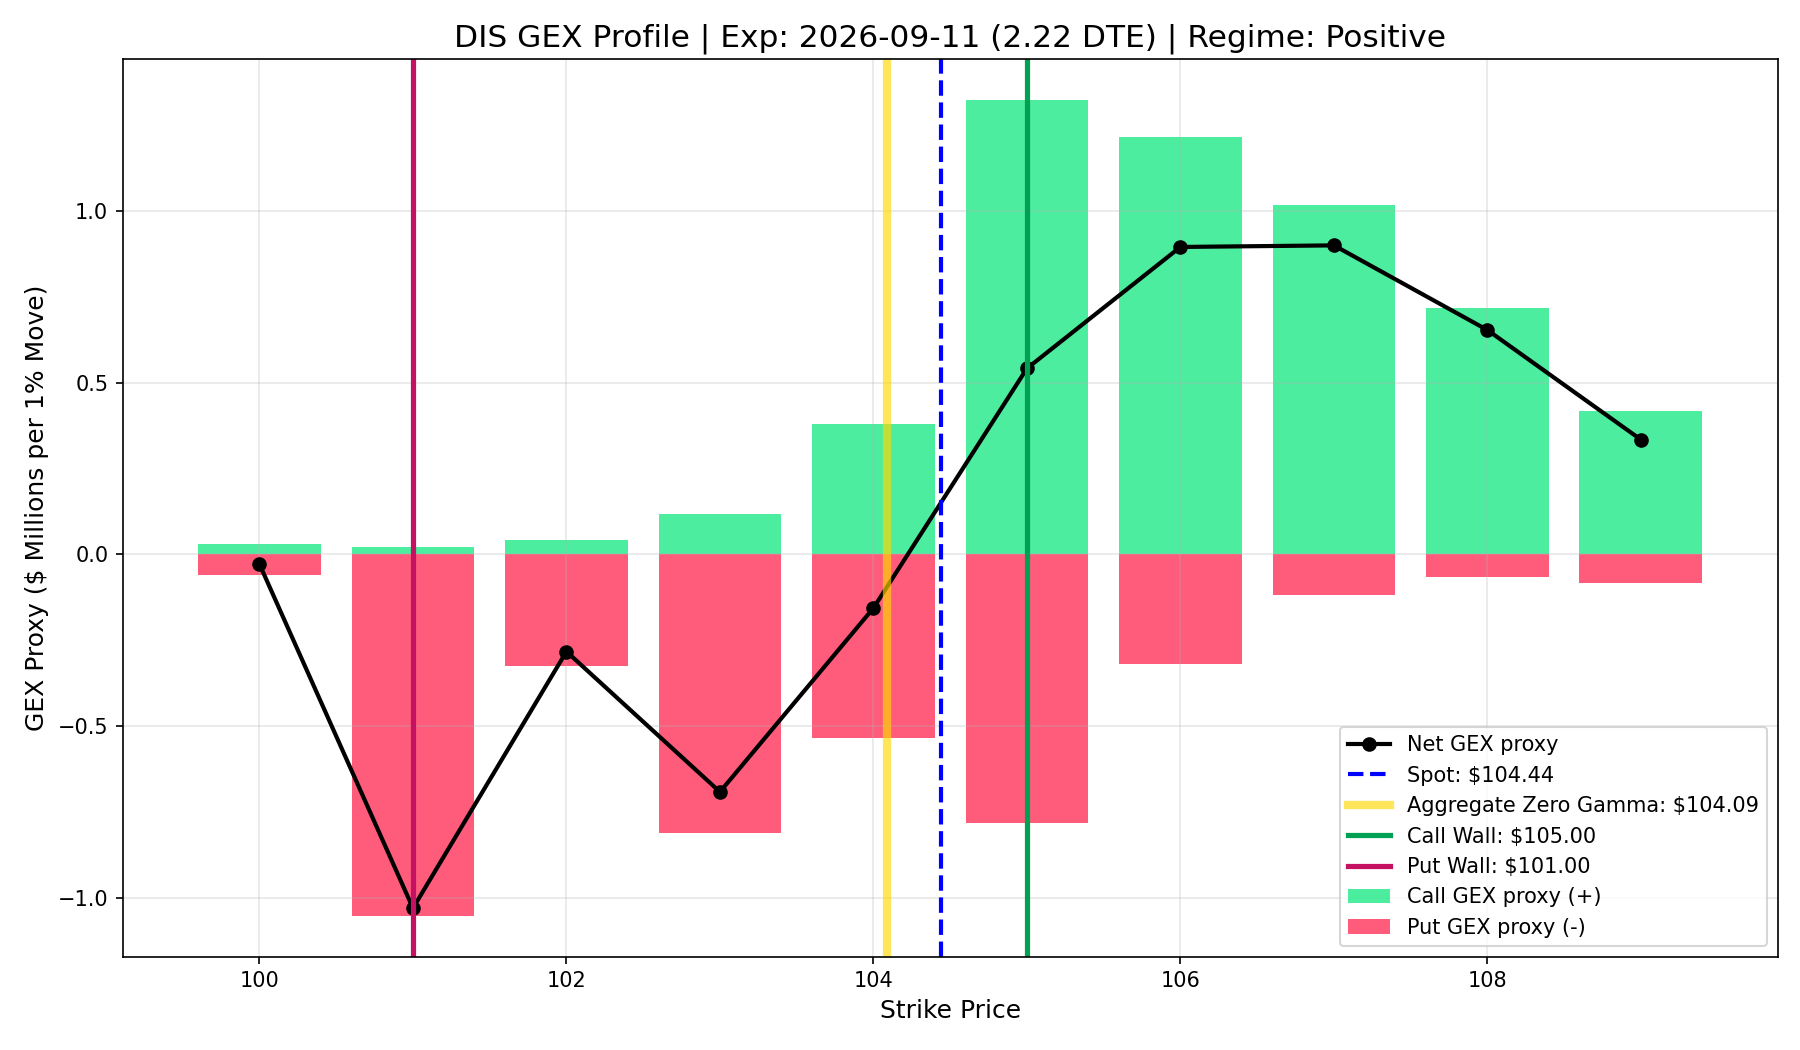
DIS
- Current Price: $154.87
- Call Wall (Resistance): $96.00
- Put Wall (Support): $93.00
- Market Regime: Positive (Dealers Suppressing Volatility)
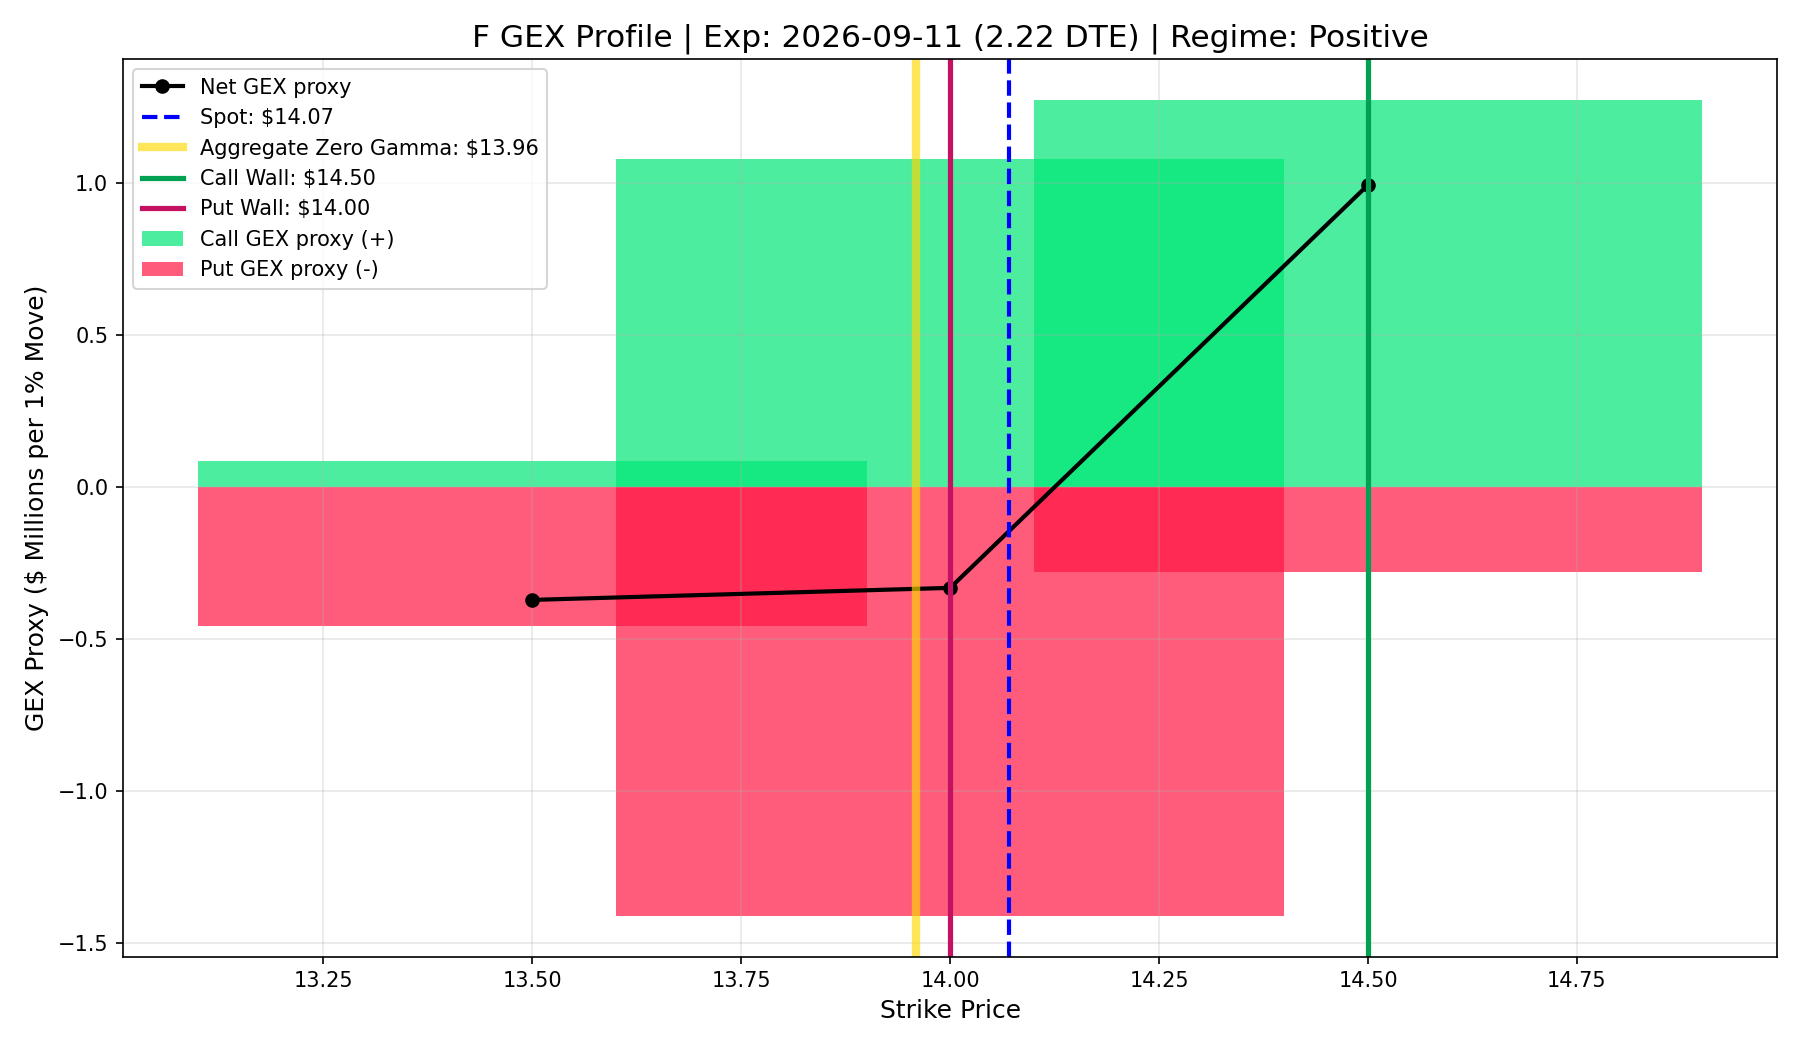
F
- Current Price: $154.87
- Call Wall (Resistance): $15.00
- Put Wall (Support): $14.00
- Market Regime: Positive (Dealers Suppressing Volatility)
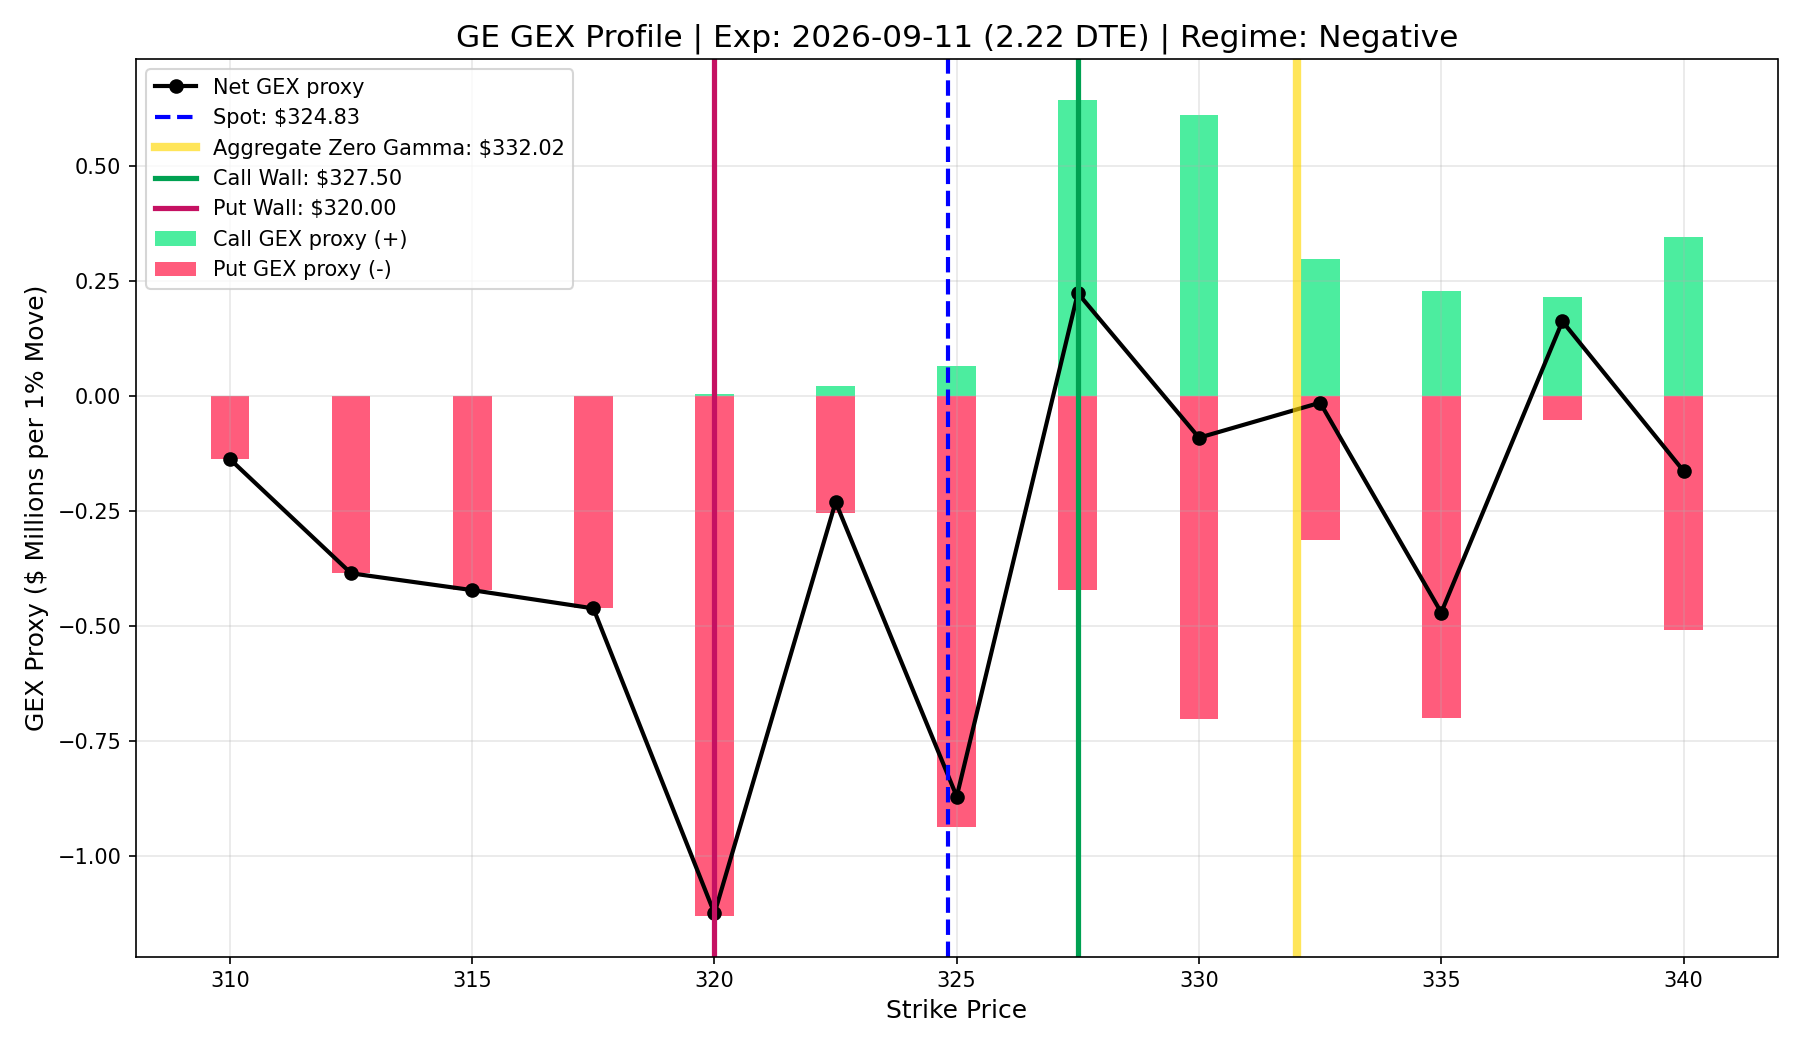
GE
- Current Price: $154.87
- Call Wall (Resistance): $365.00
- Put Wall (Support): $350.00
- Market Regime: Positive (Dealers Suppressing Volatility)
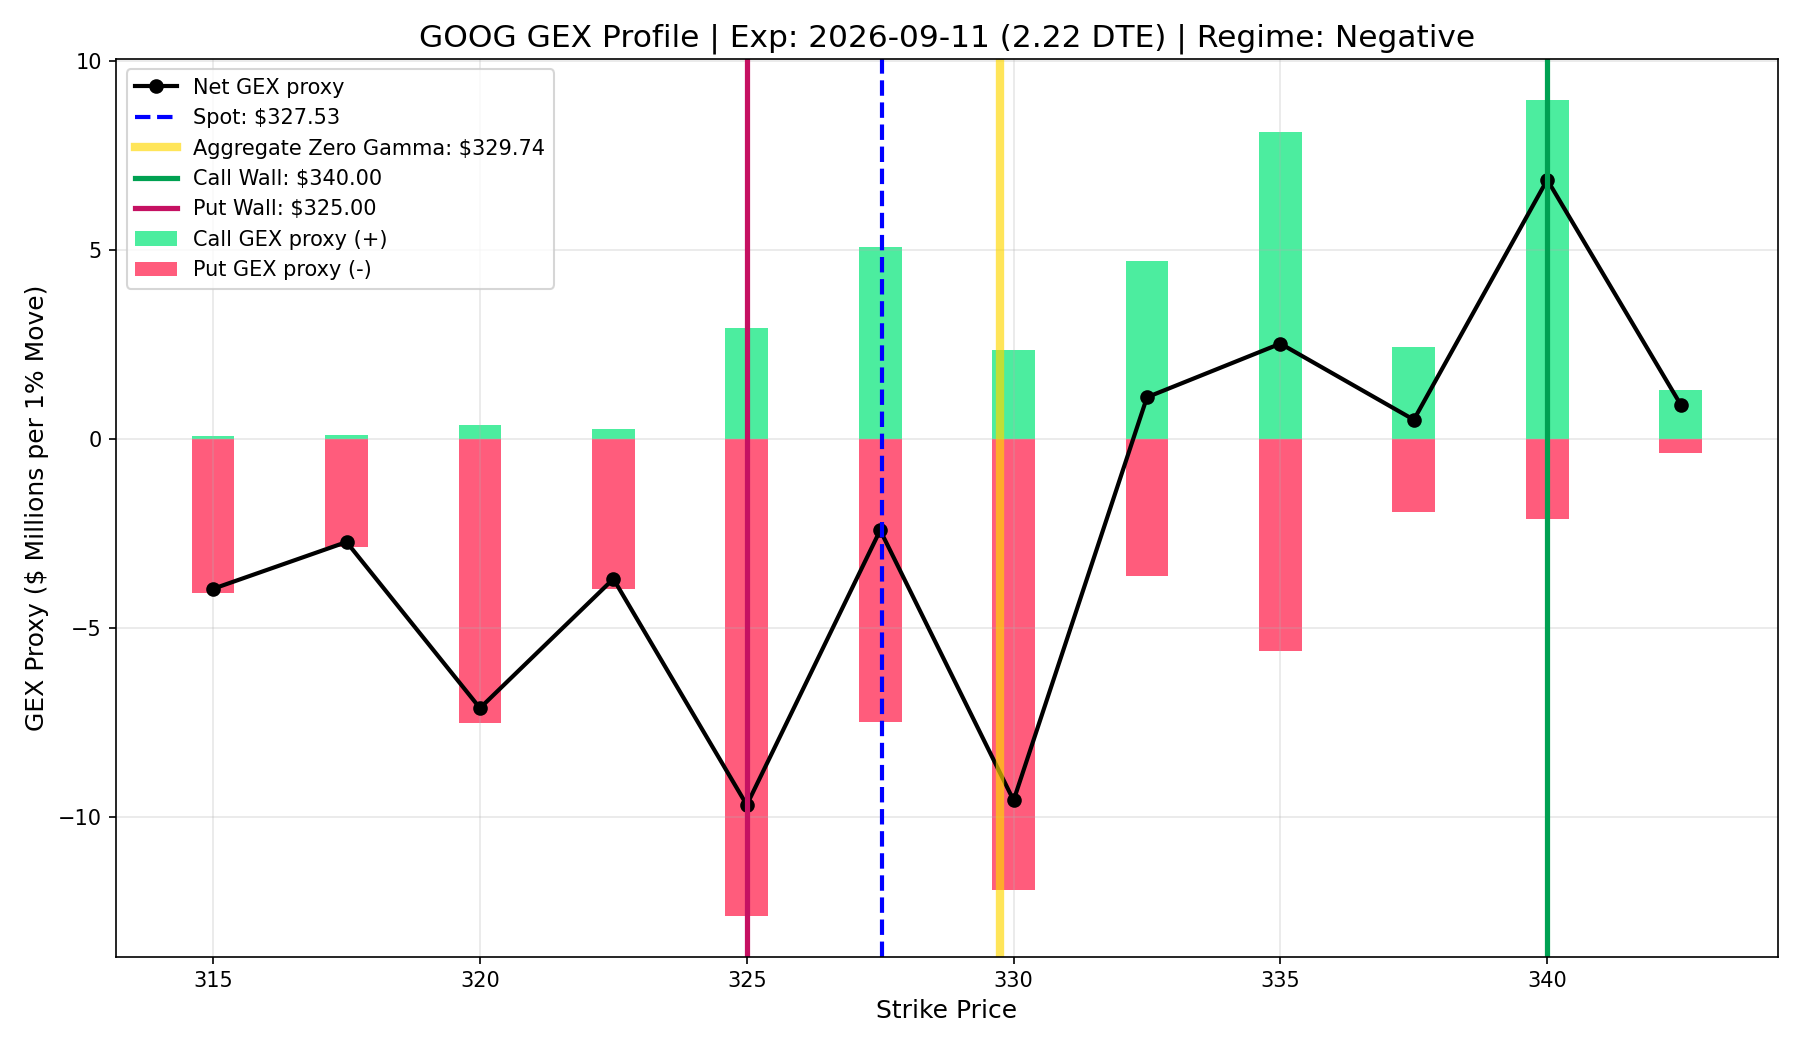
GOOG
- Current Price: $154.87
- Call Wall (Resistance): $330.00
- Put Wall (Support): $320.00
- Market Regime: Positive (Dealers Suppressing Volatility)
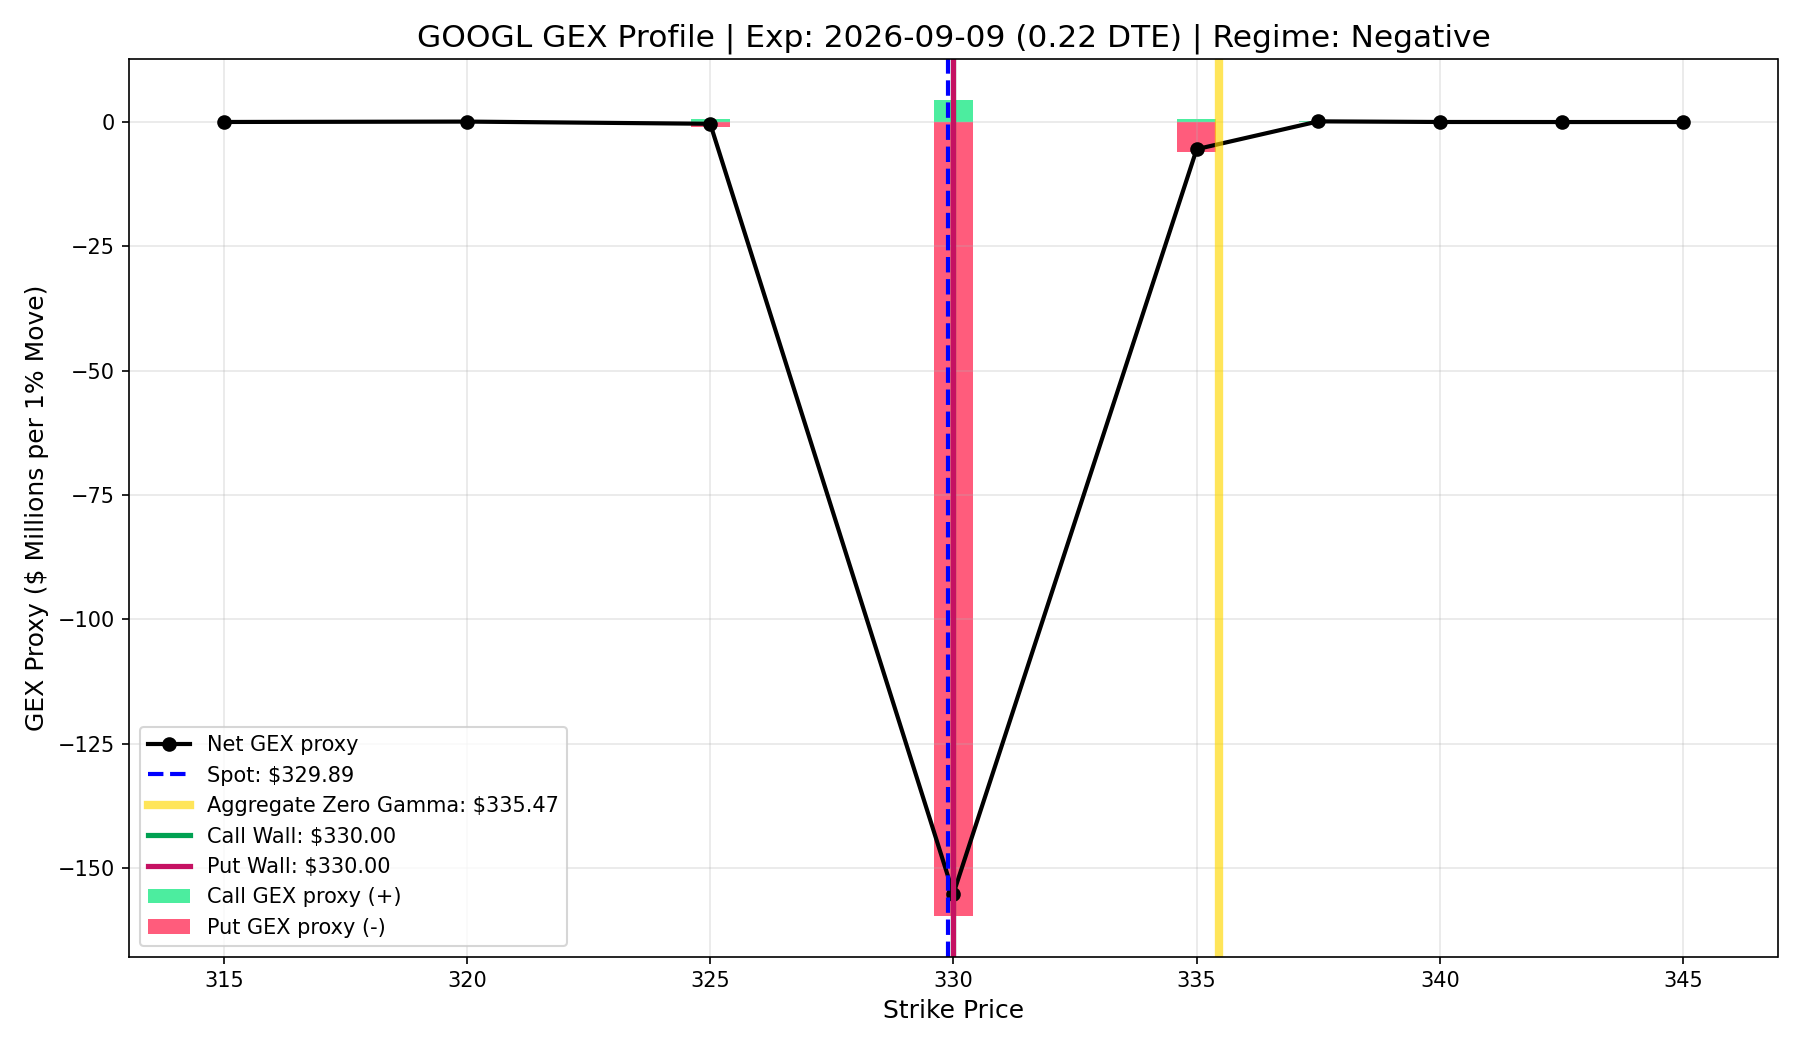
GOOGL
- Current Price: $154.87
- Call Wall (Resistance): $325.00
- Put Wall (Support): $325.00
- Market Regime: Positive (Dealers Suppressing Volatility)
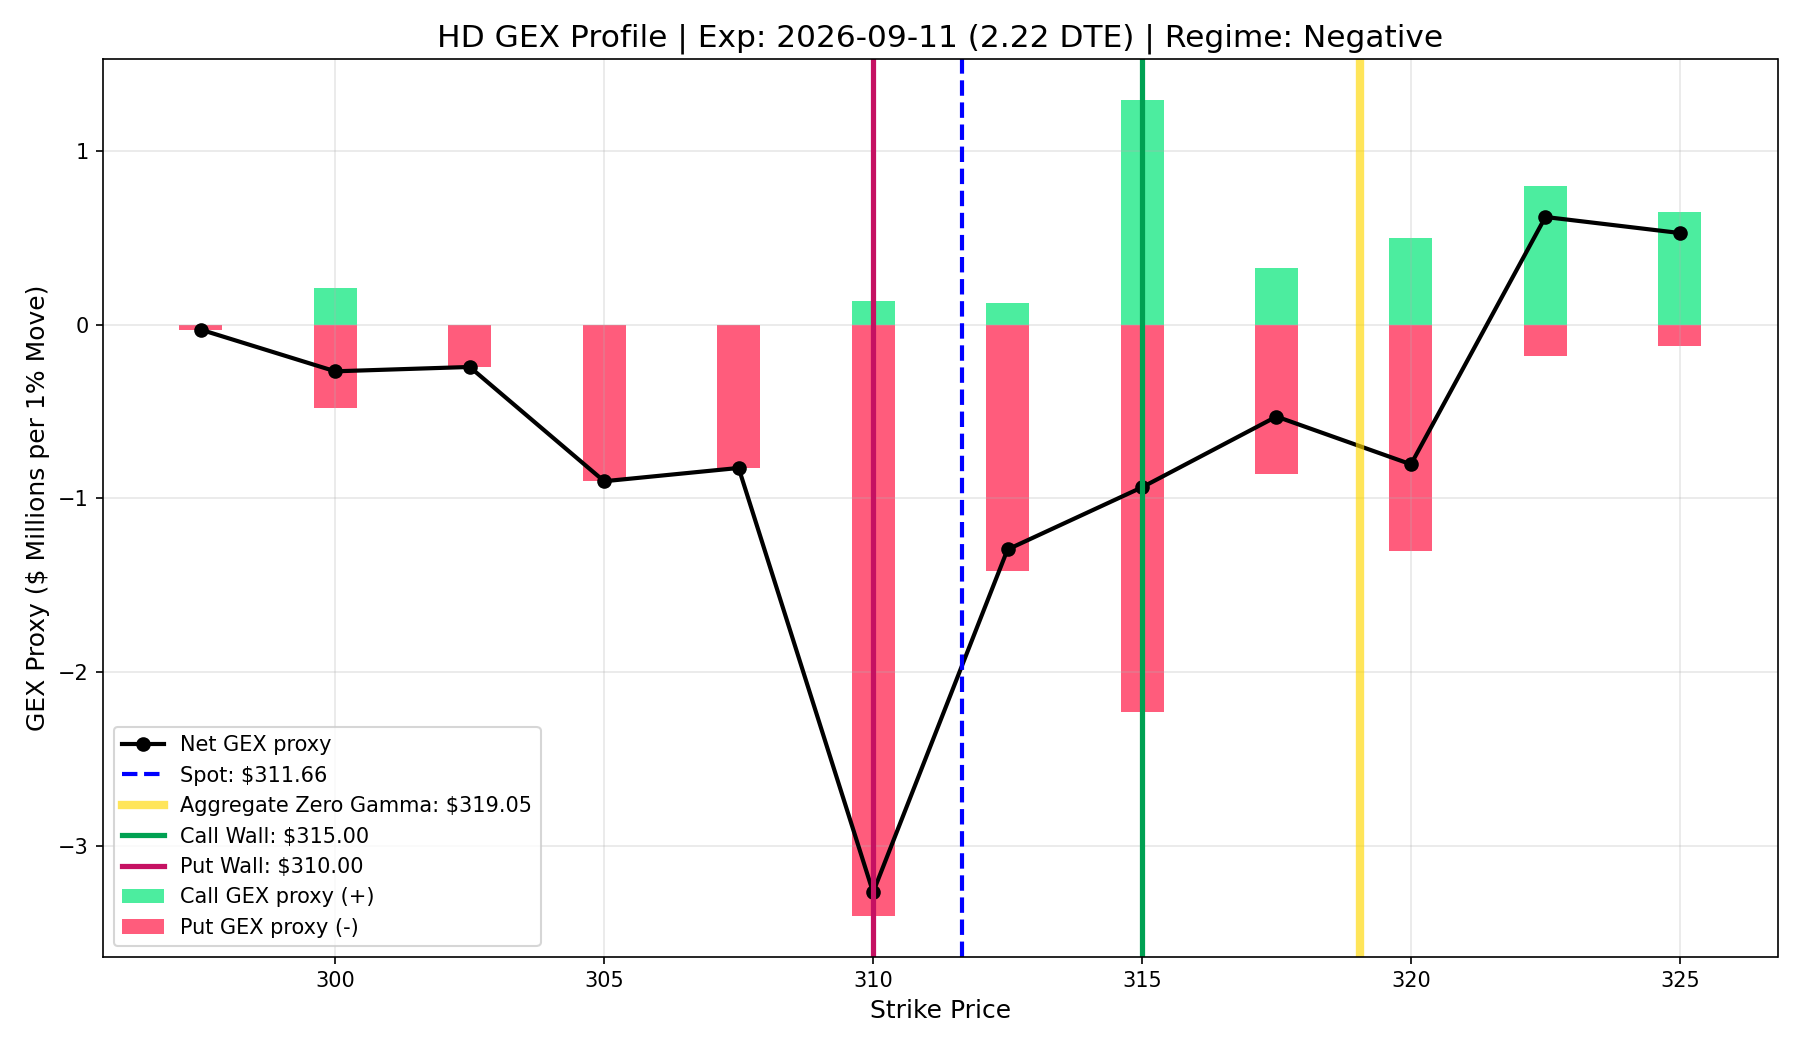
HD
- Current Price: $154.87
- Call Wall (Resistance): $335.00
- Put Wall (Support): $330.00
- Market Regime: Positive (Dealers Suppressing Volatility)
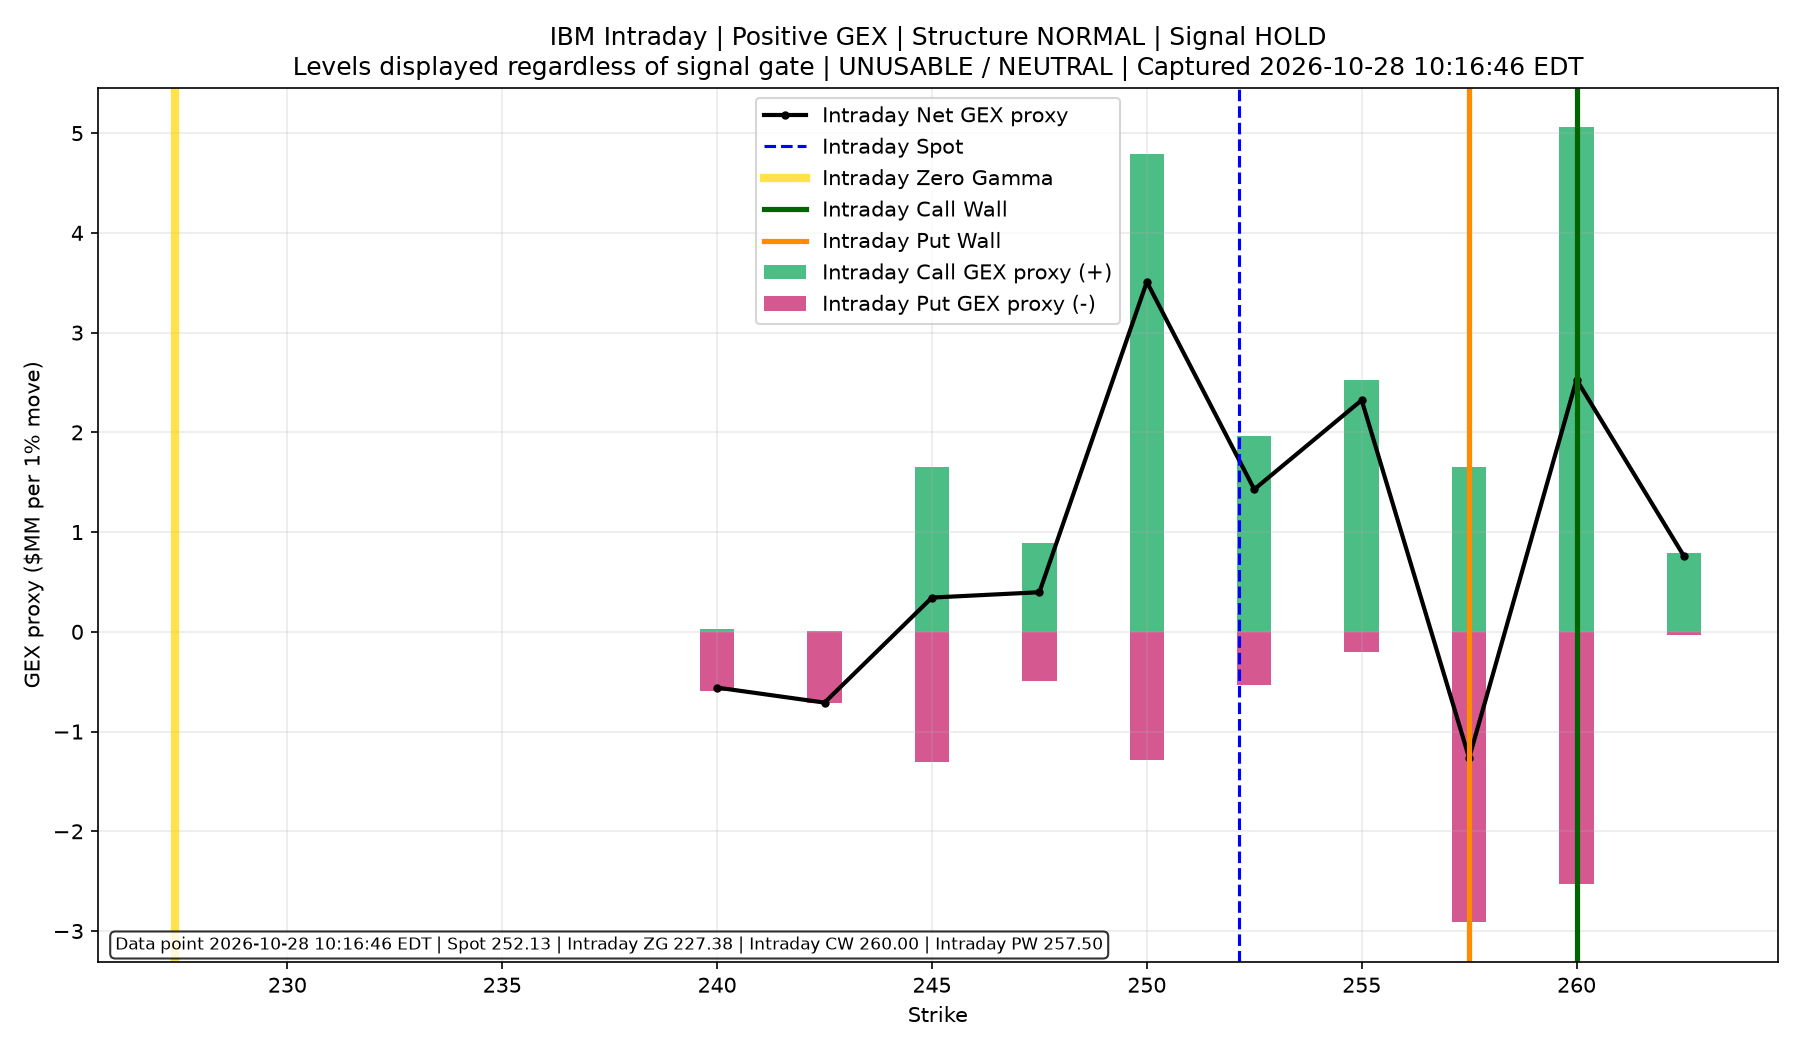
IBM
- Current Price: $154.87
- Call Wall (Resistance): $220.00
- Put Wall (Support): $210.00
- Market Regime: Positive (Dealers Suppressing Volatility)
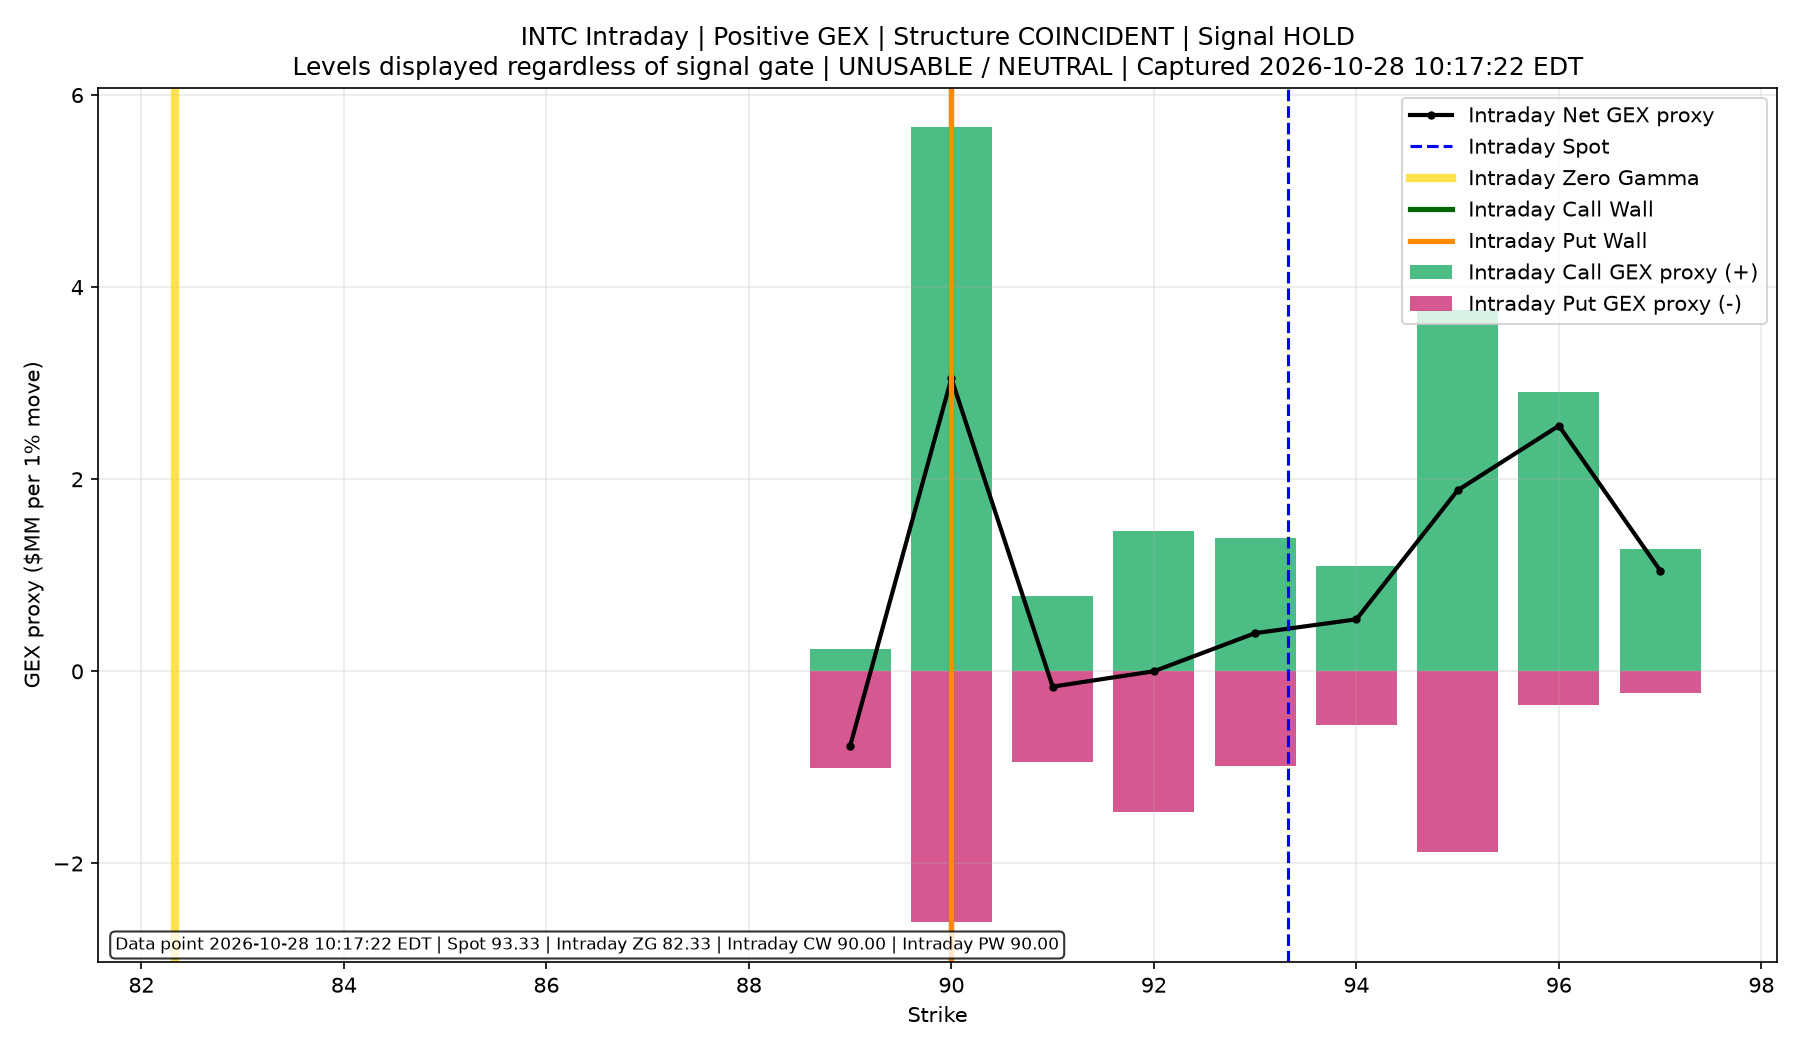
INTC
- Current Price: $154.87
- Call Wall (Resistance): $92.00
- Put Wall (Support): $92.00
- Market Regime: Negative (Dealers Amplifying Volatility)
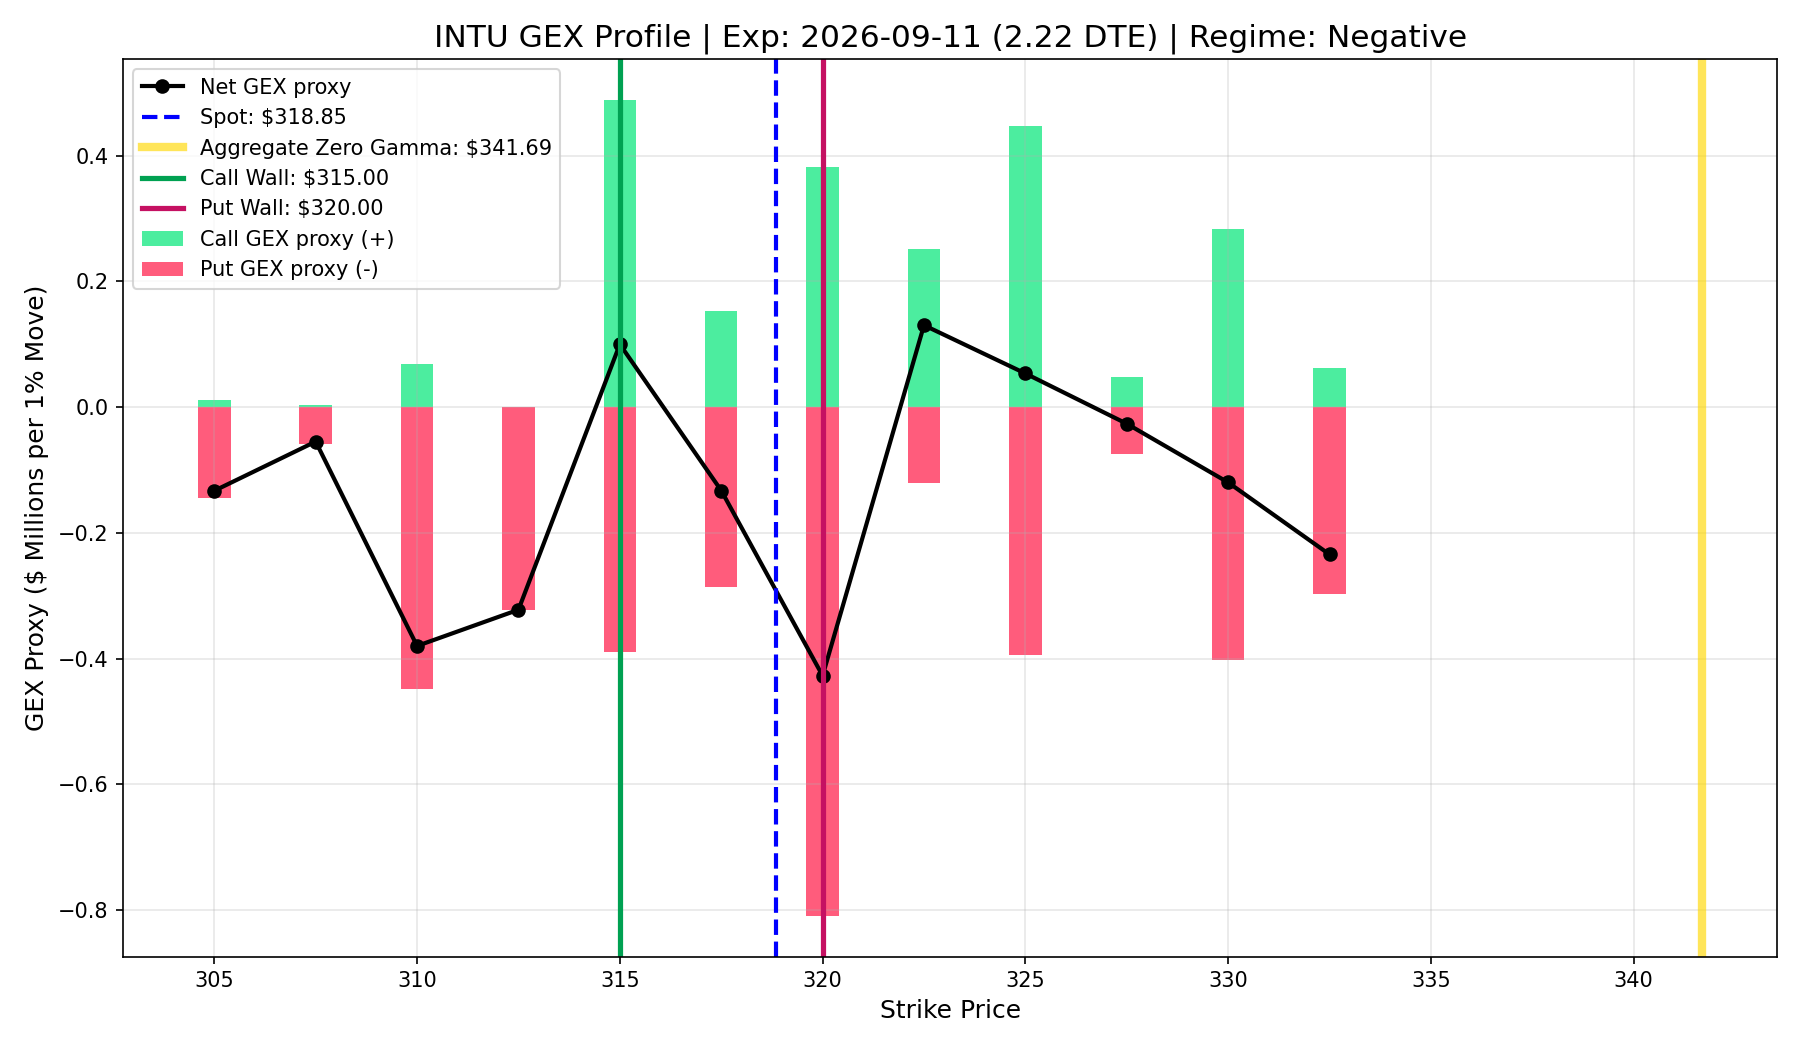
INTU
- Current Price: $154.87
- Call Wall (Resistance): $310.00
- Put Wall (Support): $295.00
- Market Regime: Positive (Dealers Suppressing Volatility)
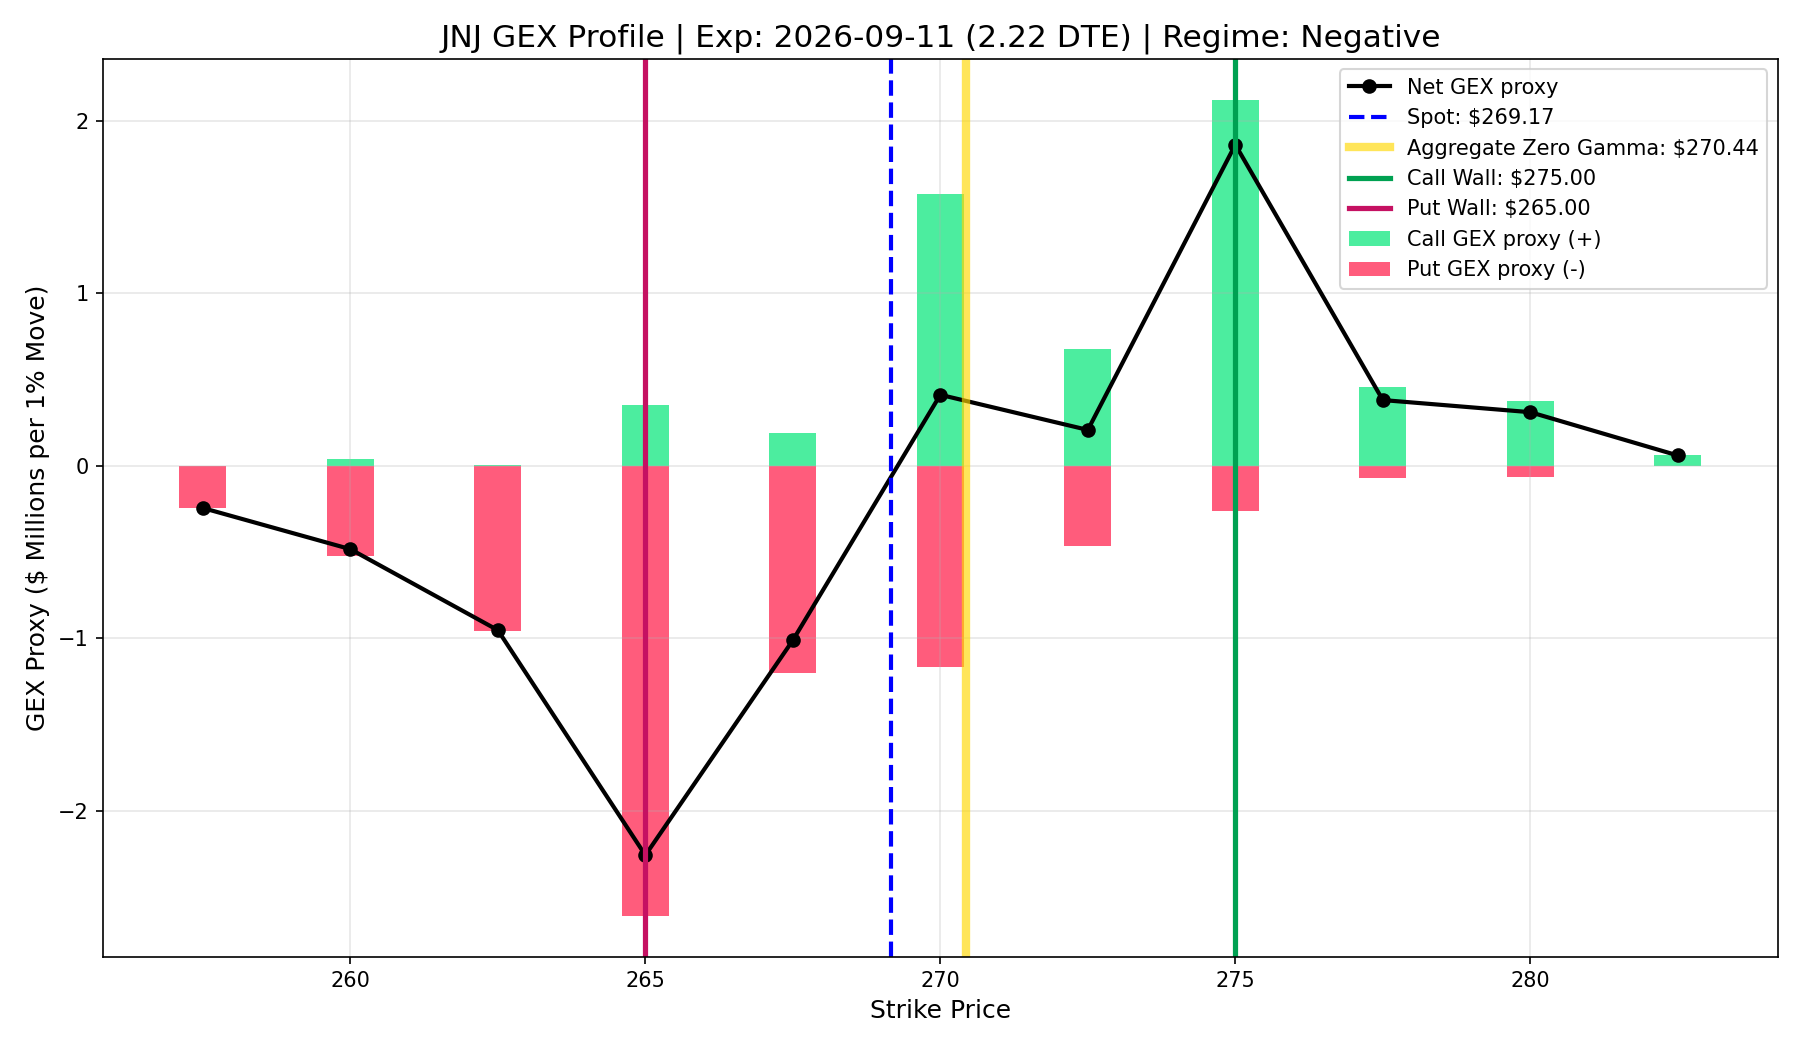
JNJ
- Current Price: $154.87
- Call Wall (Resistance): $267.50
- Put Wall (Support): $260.00
- Market Regime: Positive (Dealers Suppressing Volatility)
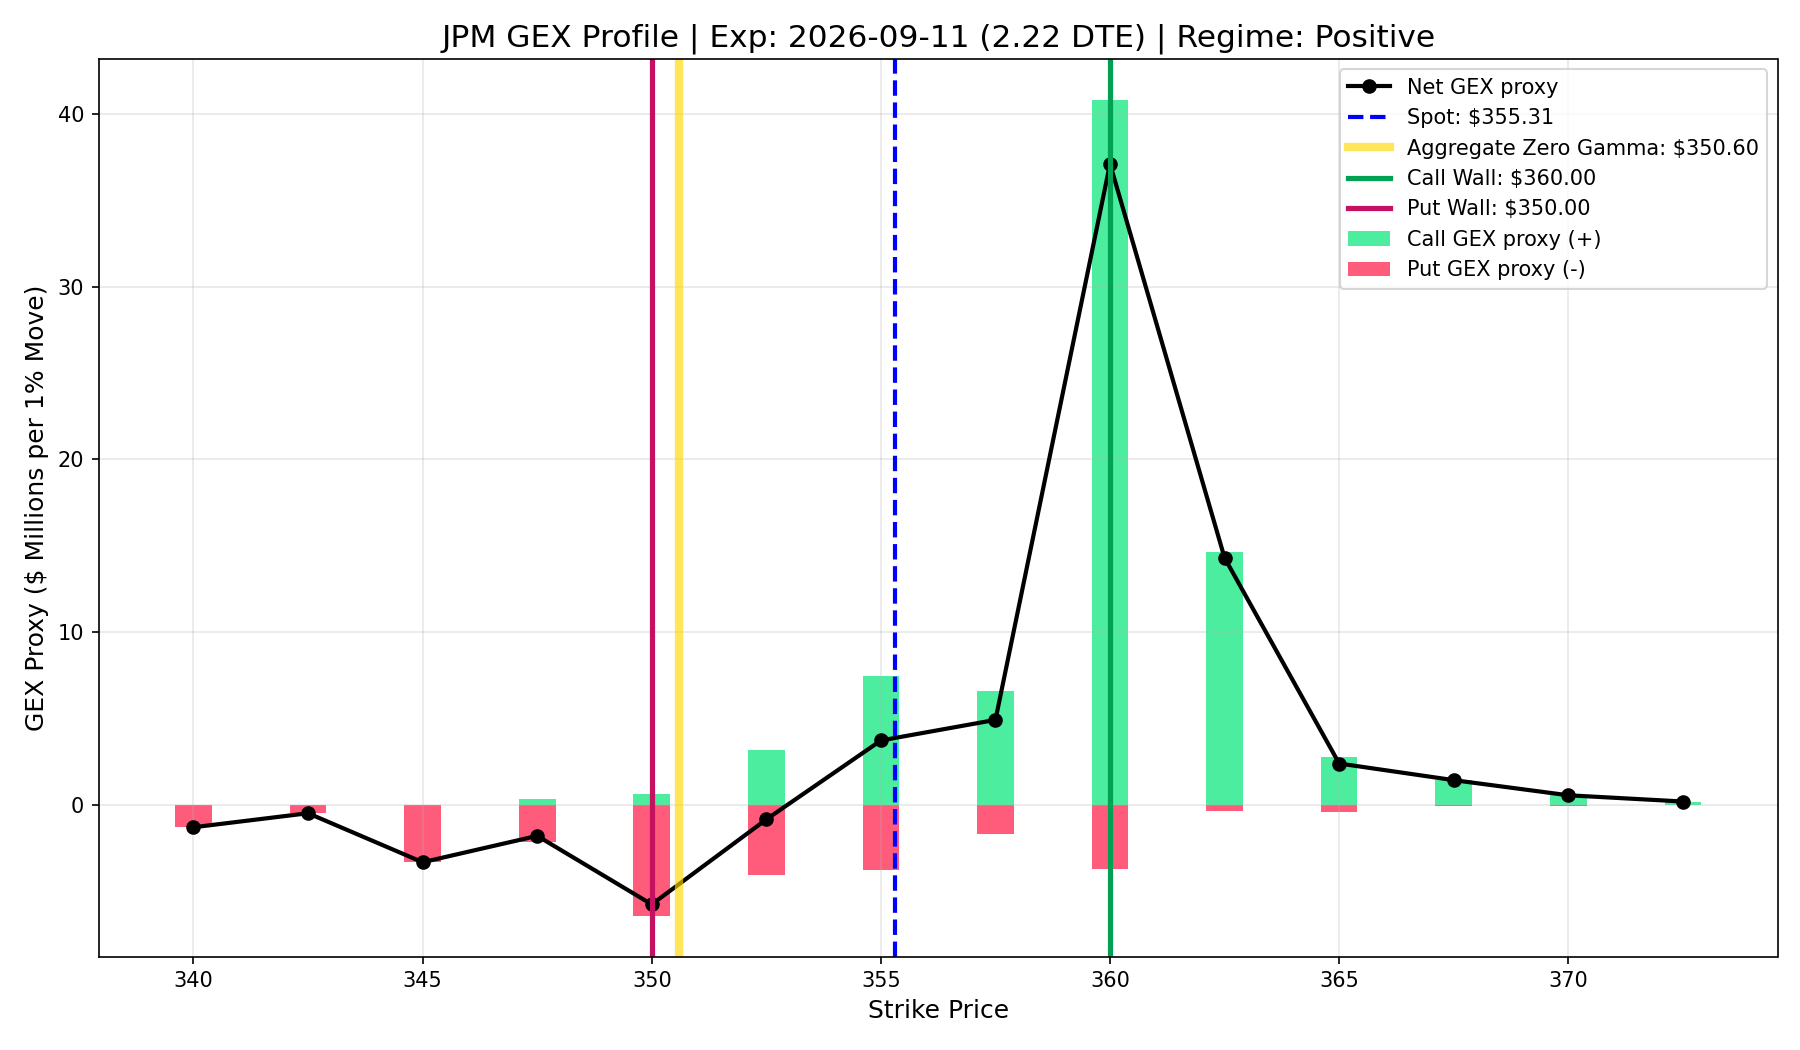
JPM
- Current Price: $154.87
- Call Wall (Resistance): $350.00
- Put Wall (Support): $347.50
- Market Regime: Positive (Dealers Suppressing Volatility)
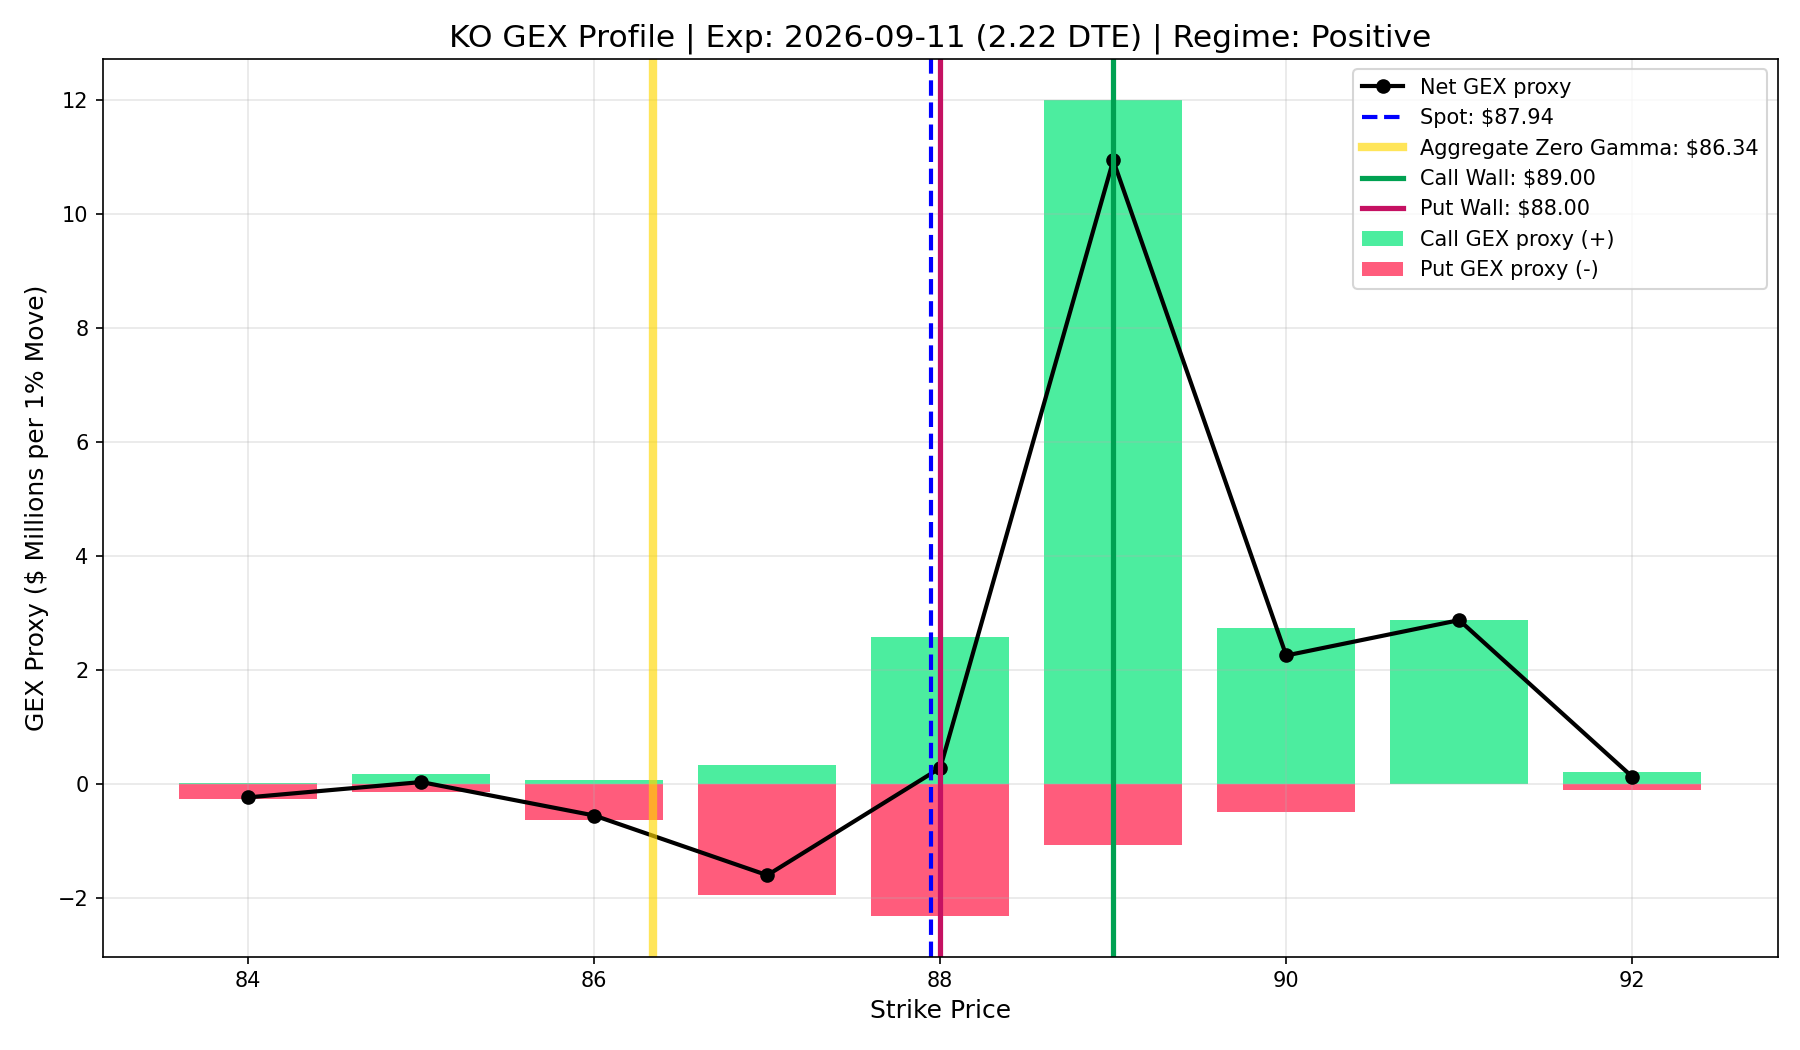
KO
- Current Price: $154.87
- Call Wall (Resistance): $85.00
- Put Wall (Support): $82.00
- Market Regime: Positive (Dealers Suppressing Volatility)
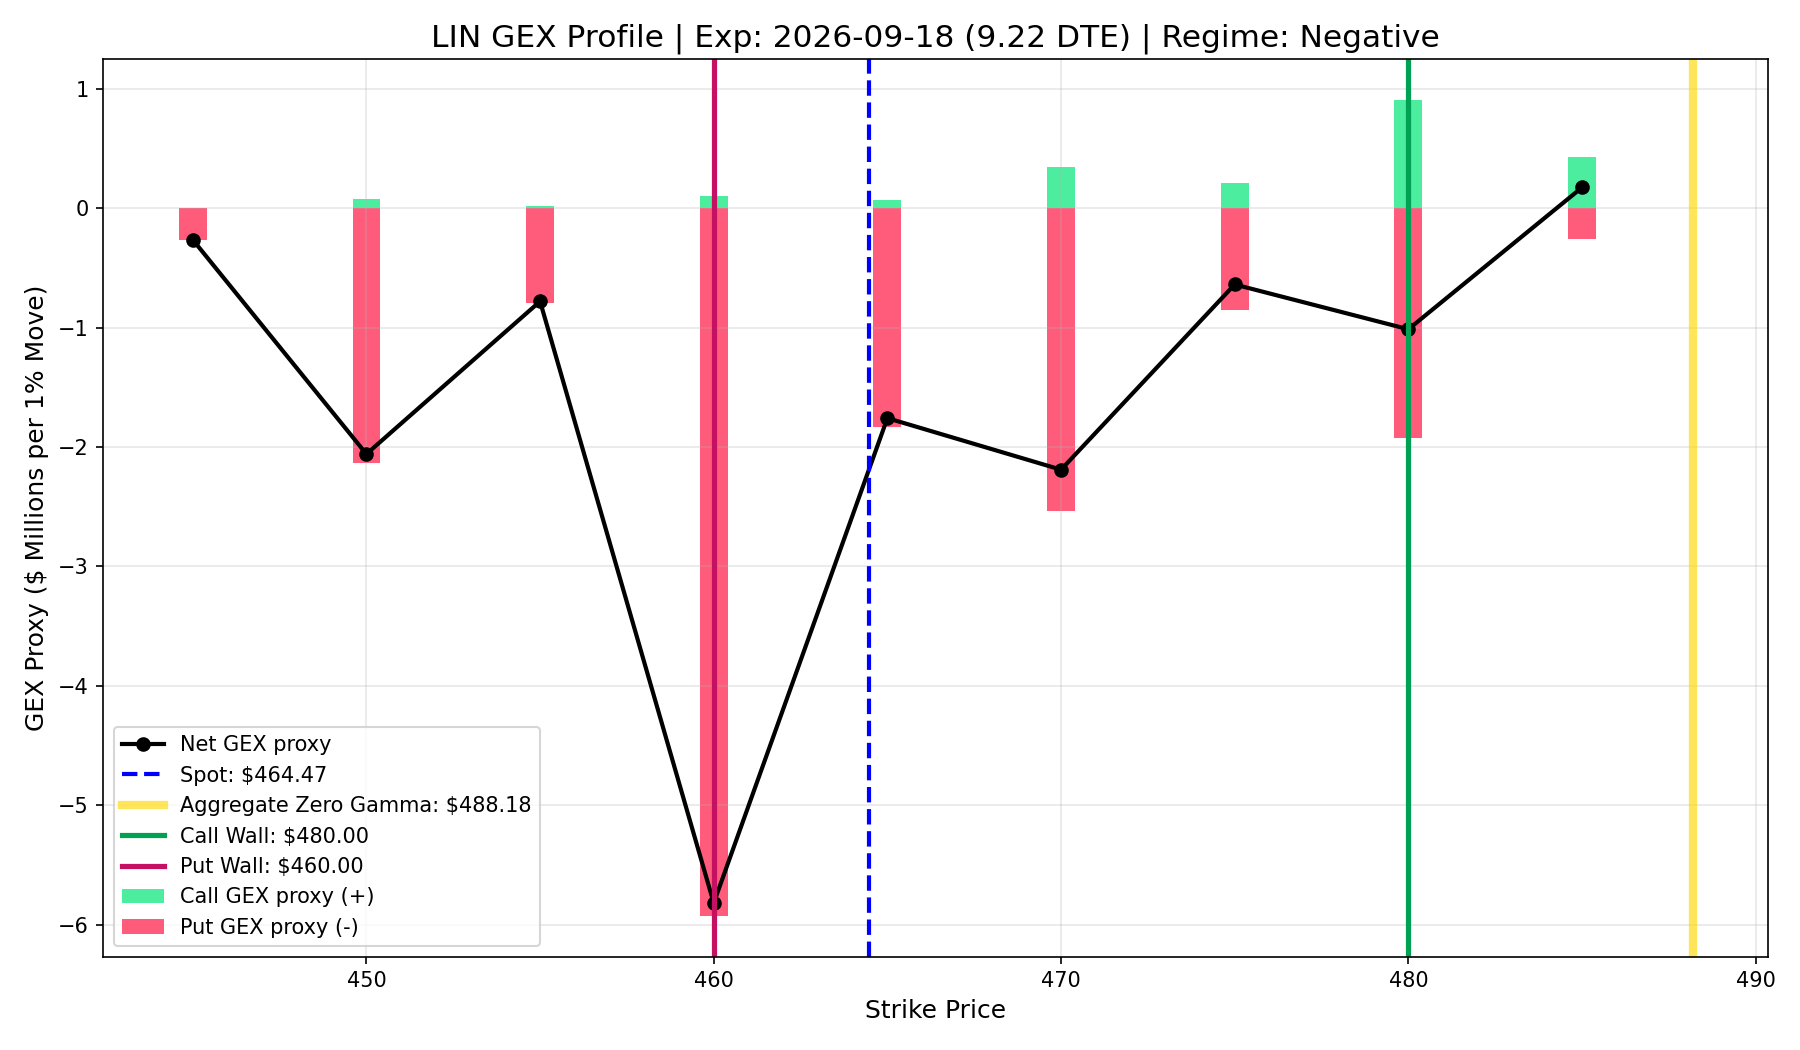
LIN
- Current Price: $154.87
- Call Wall (Resistance): $510.00
- Put Wall (Support): $495.00
- Market Regime: Negative (Dealers Amplifying Volatility)
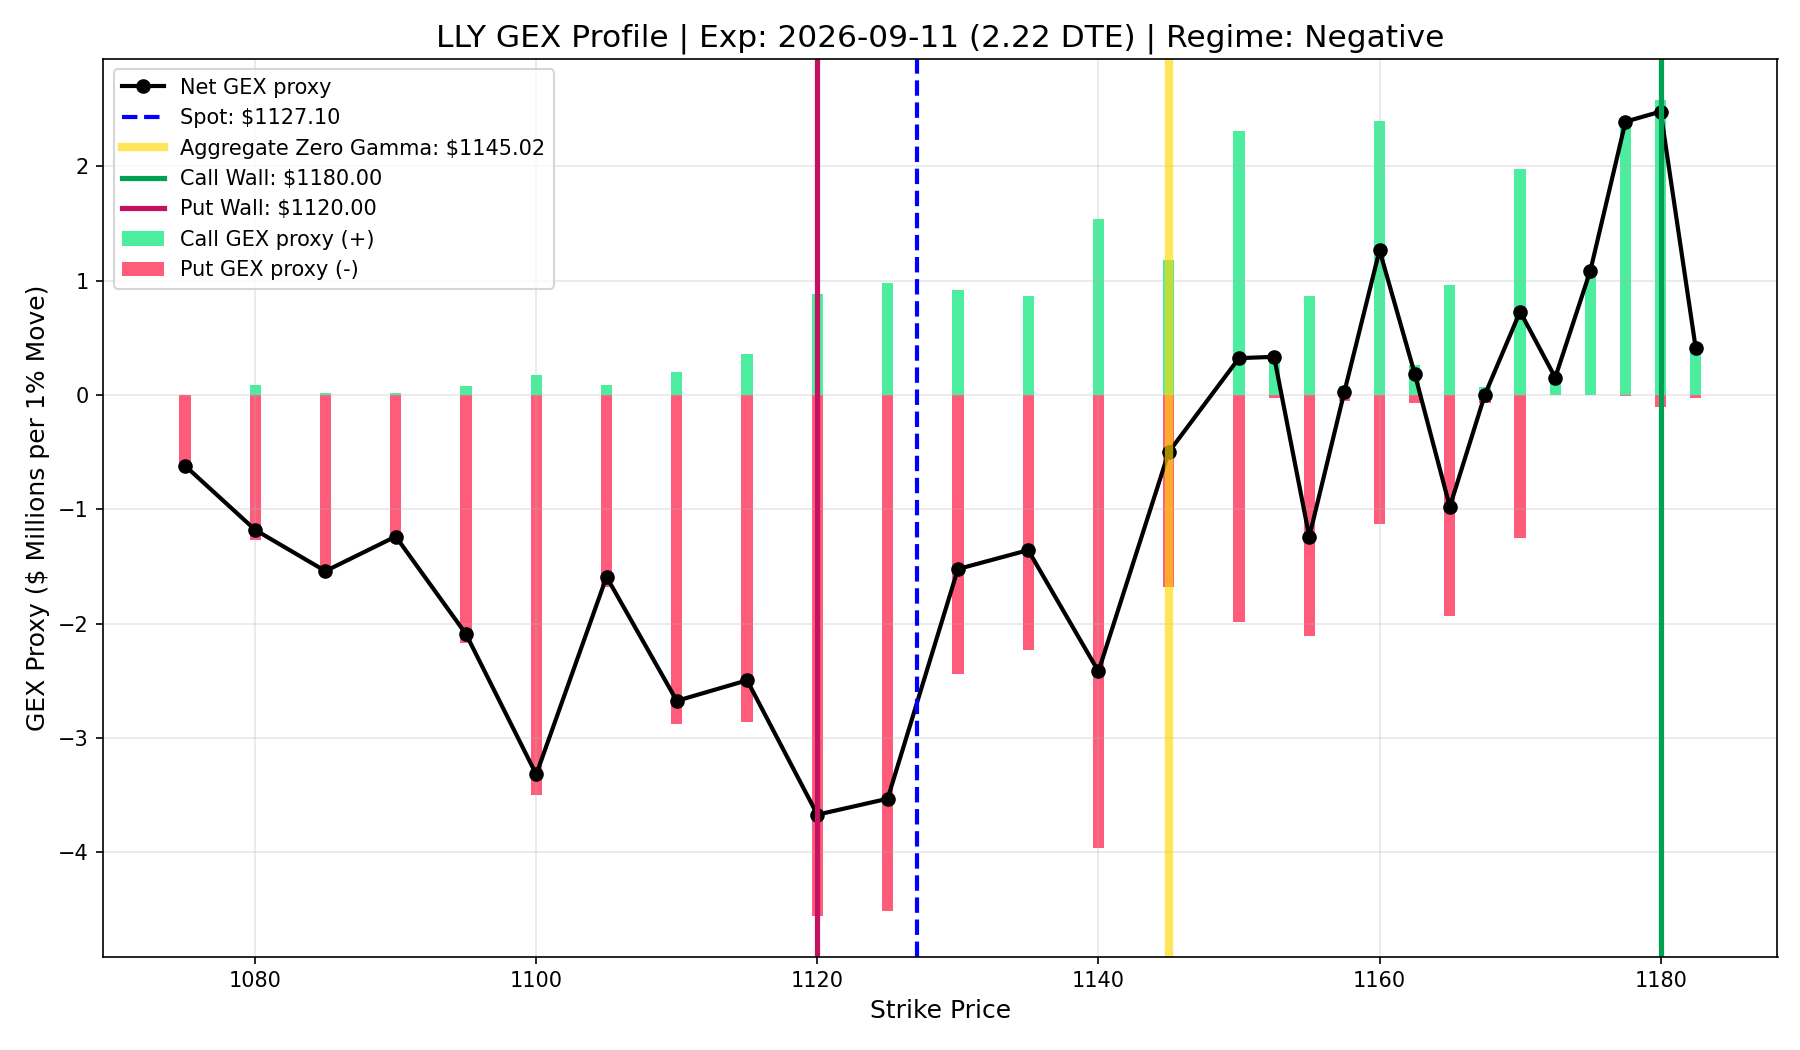
LLY
- Current Price: $154.87
- Call Wall (Resistance): $1200.00
- Put Wall (Support): $1180.00
- Market Regime: Positive (Dealers Suppressing Volatility)
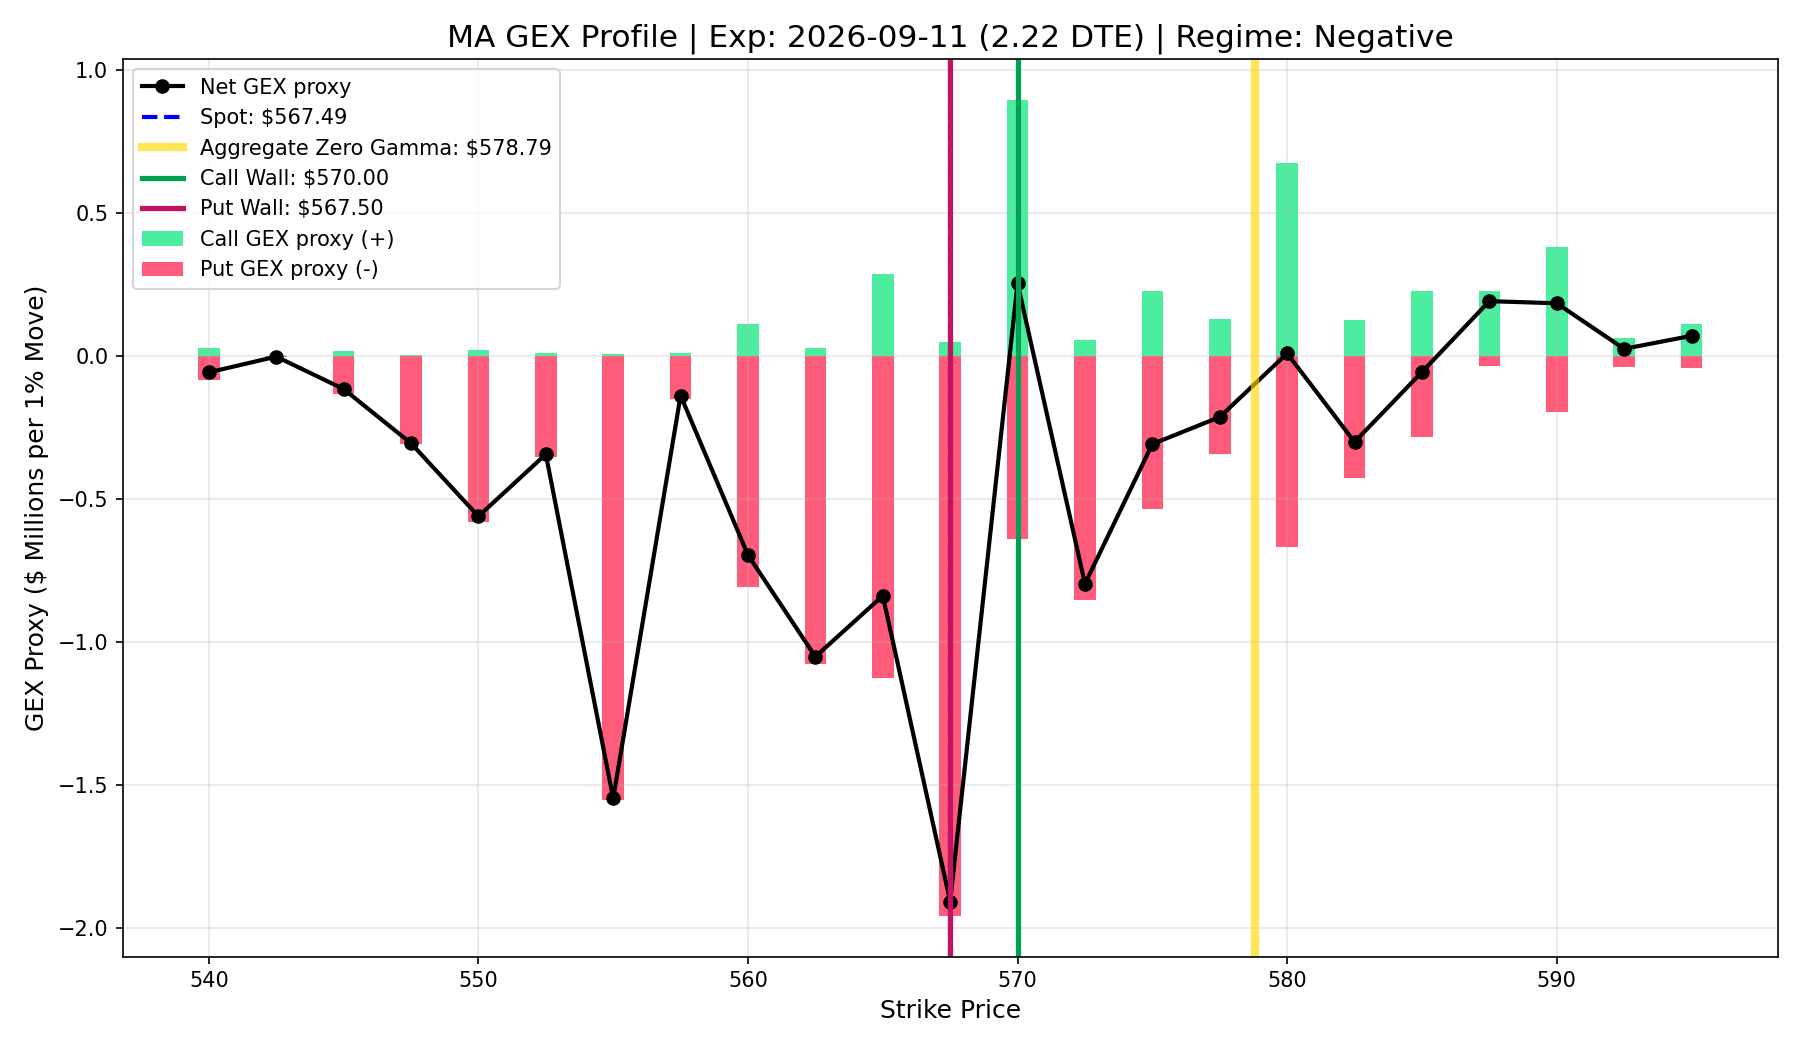
MA
- Current Price: $154.87
- Call Wall (Resistance): $550.00
- Put Wall (Support): $535.00
- Market Regime: Positive (Dealers Suppressing Volatility)
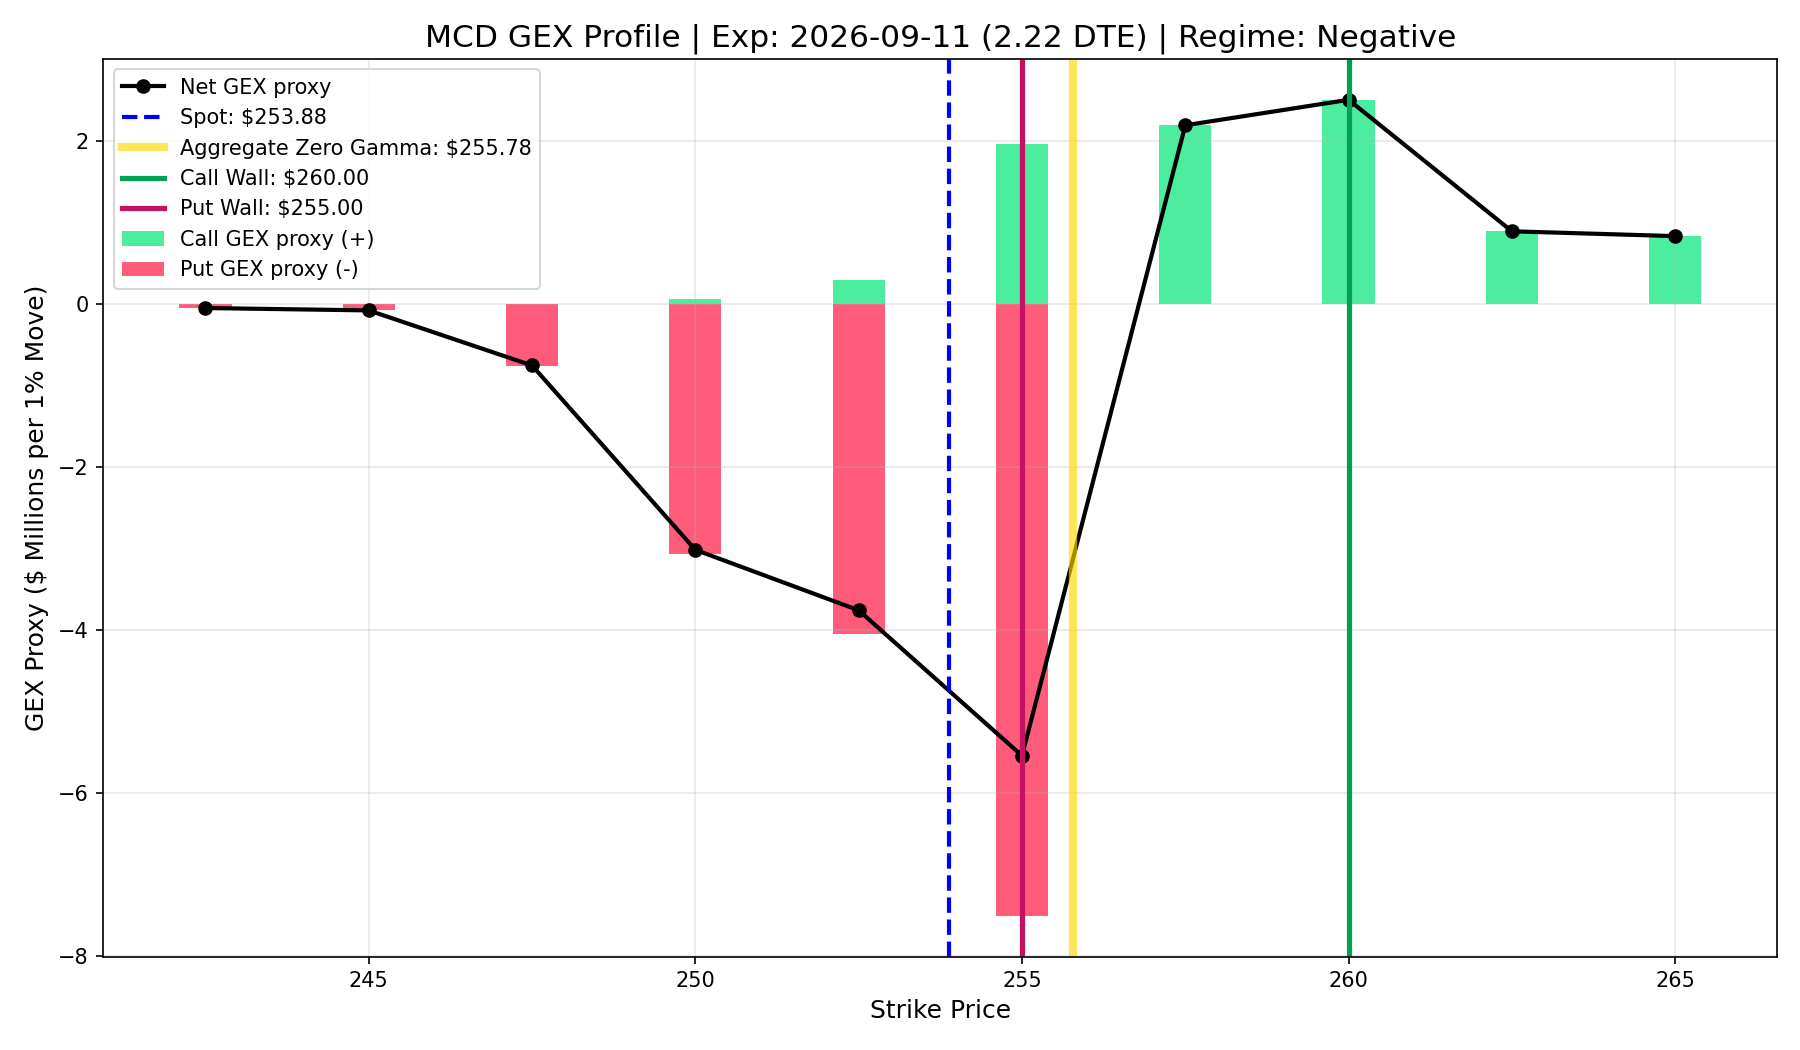
MCD
- Current Price: $154.87
- Call Wall (Resistance): $270.00
- Put Wall (Support): $265.00
- Market Regime: Positive (Dealers Suppressing Volatility)
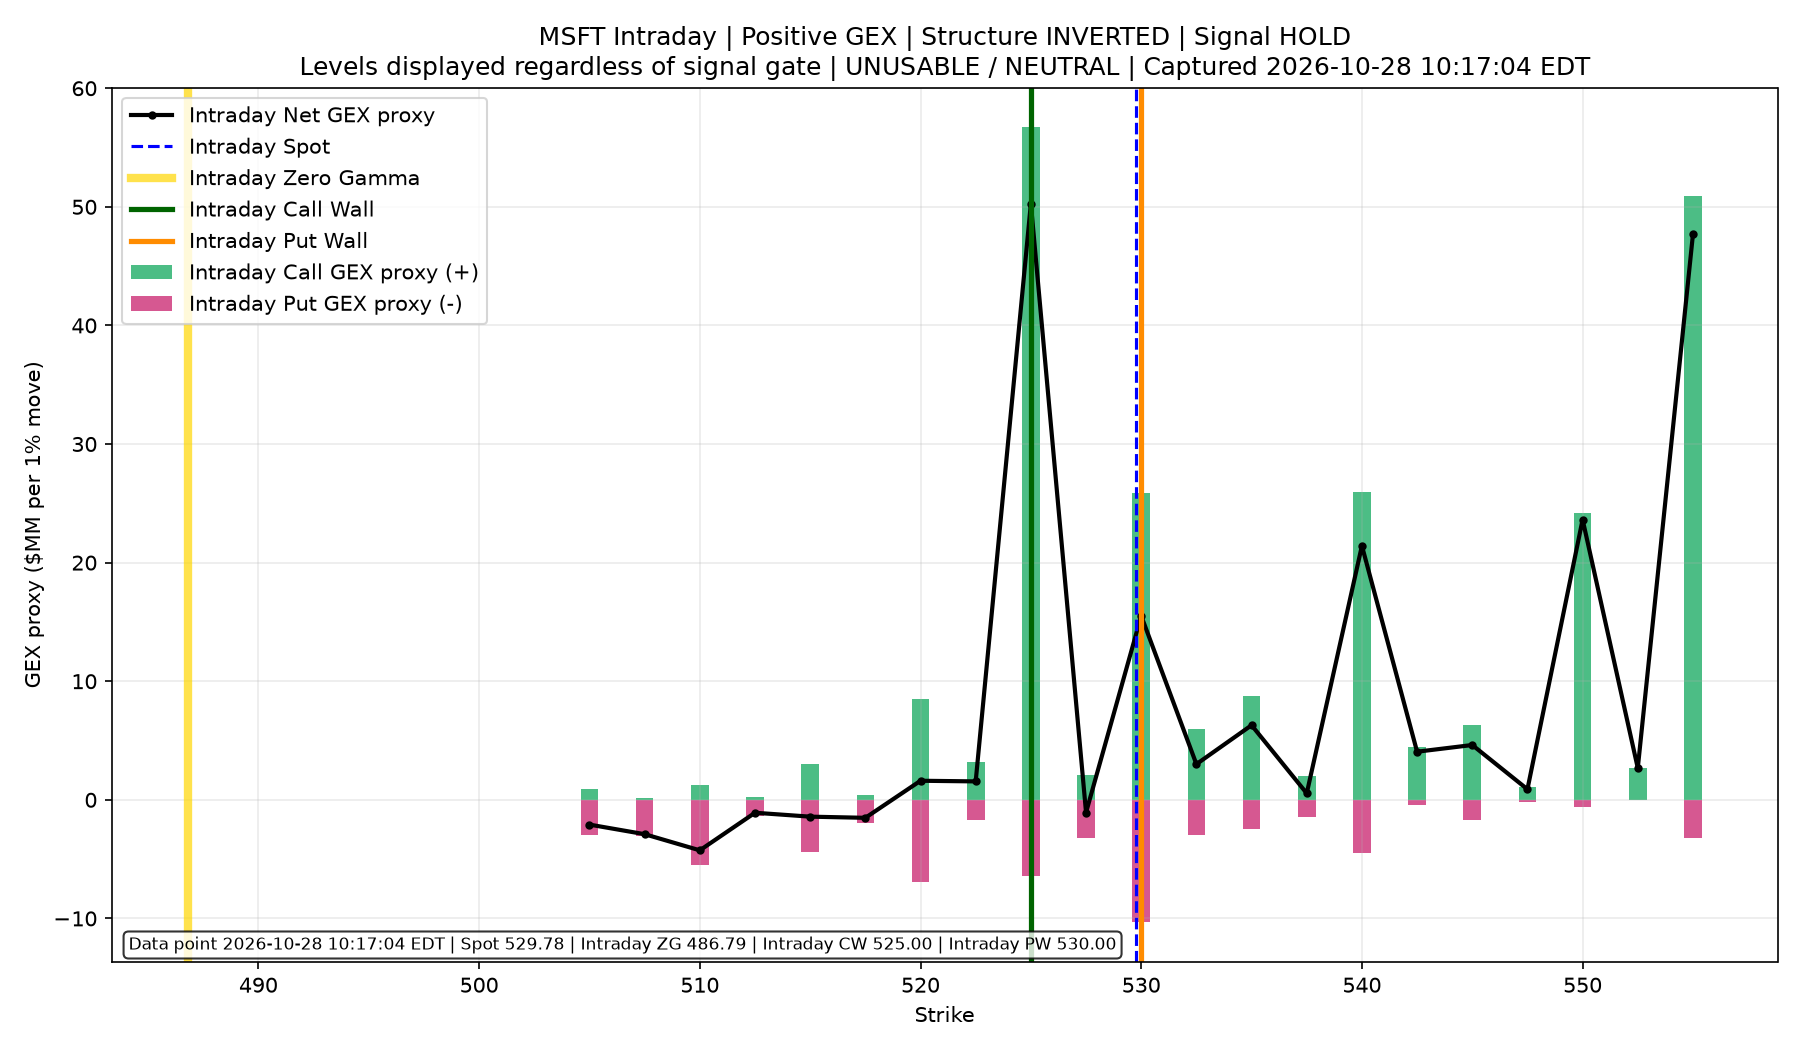
MSFT
- Current Price: $154.87
- Call Wall (Resistance): $390.00
- Put Wall (Support): $390.00
- Market Regime: Positive (Dealers Suppressing Volatility)
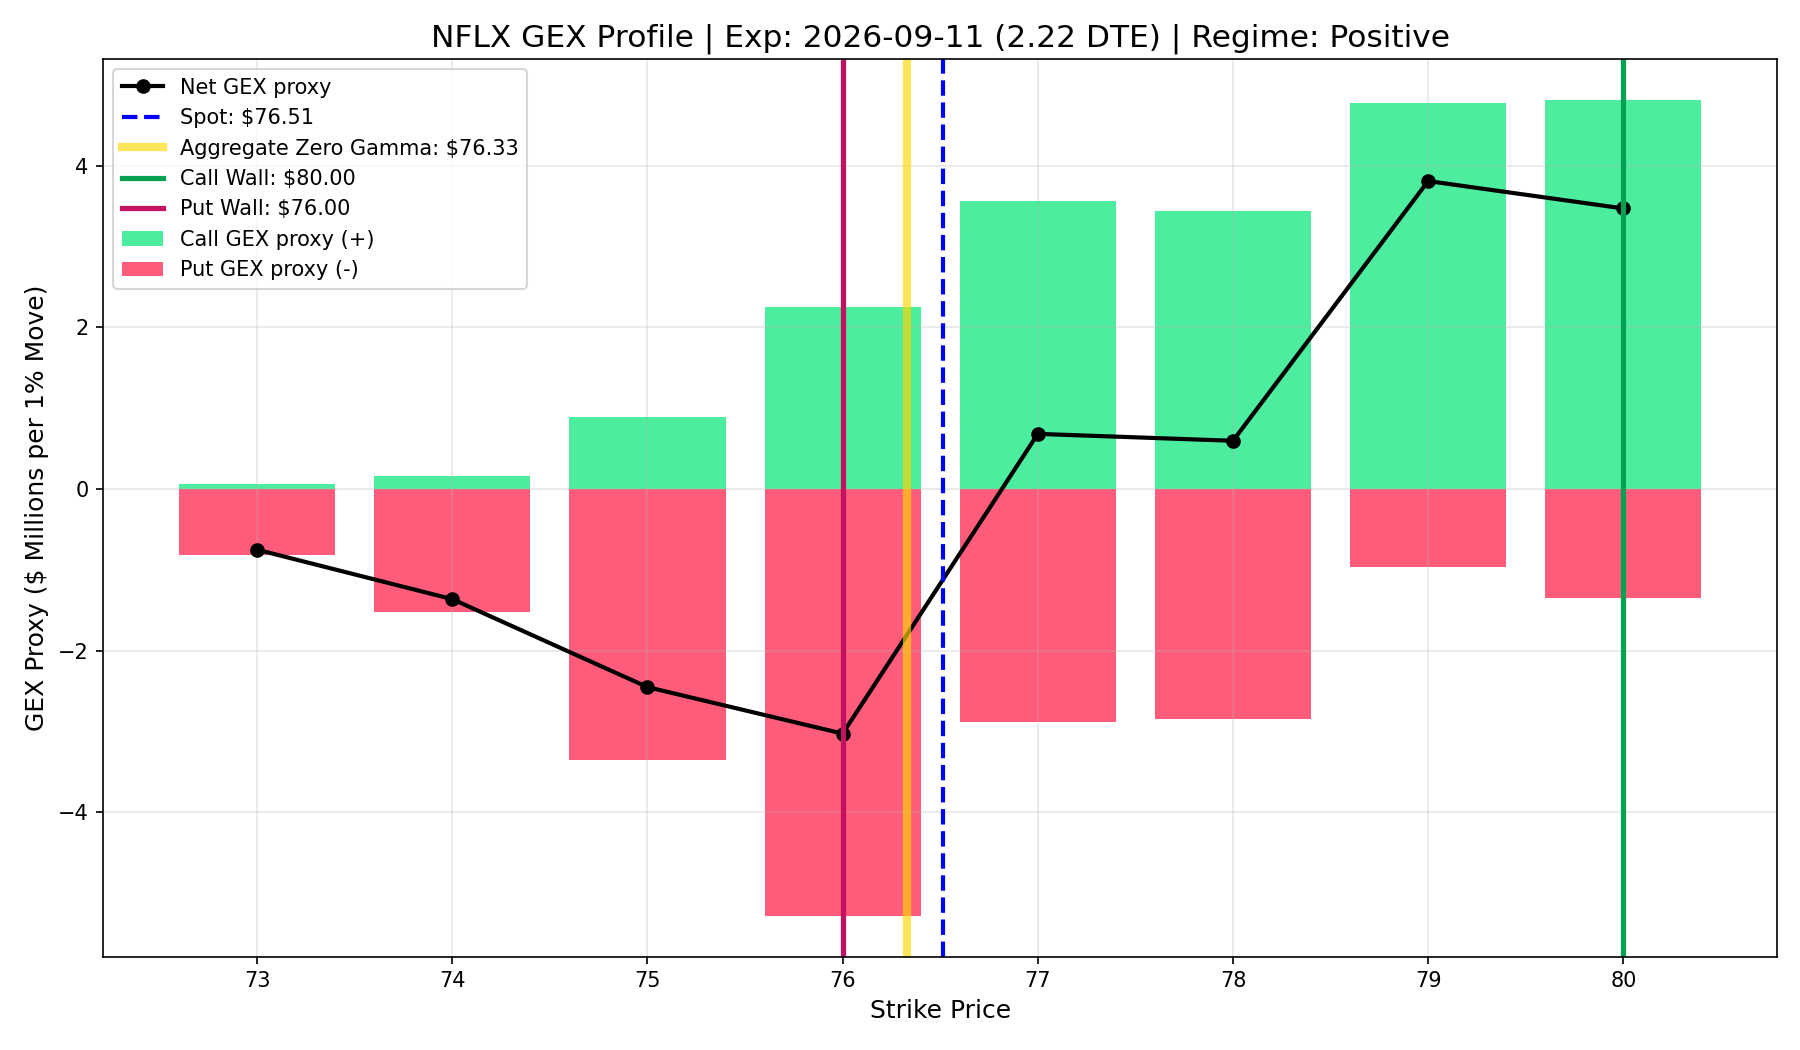
NFLX
- Current Price: $154.87
- Call Wall (Resistance): $70.00
- Put Wall (Support): $70.00
- Market Regime: Positive (Dealers Suppressing Volatility)
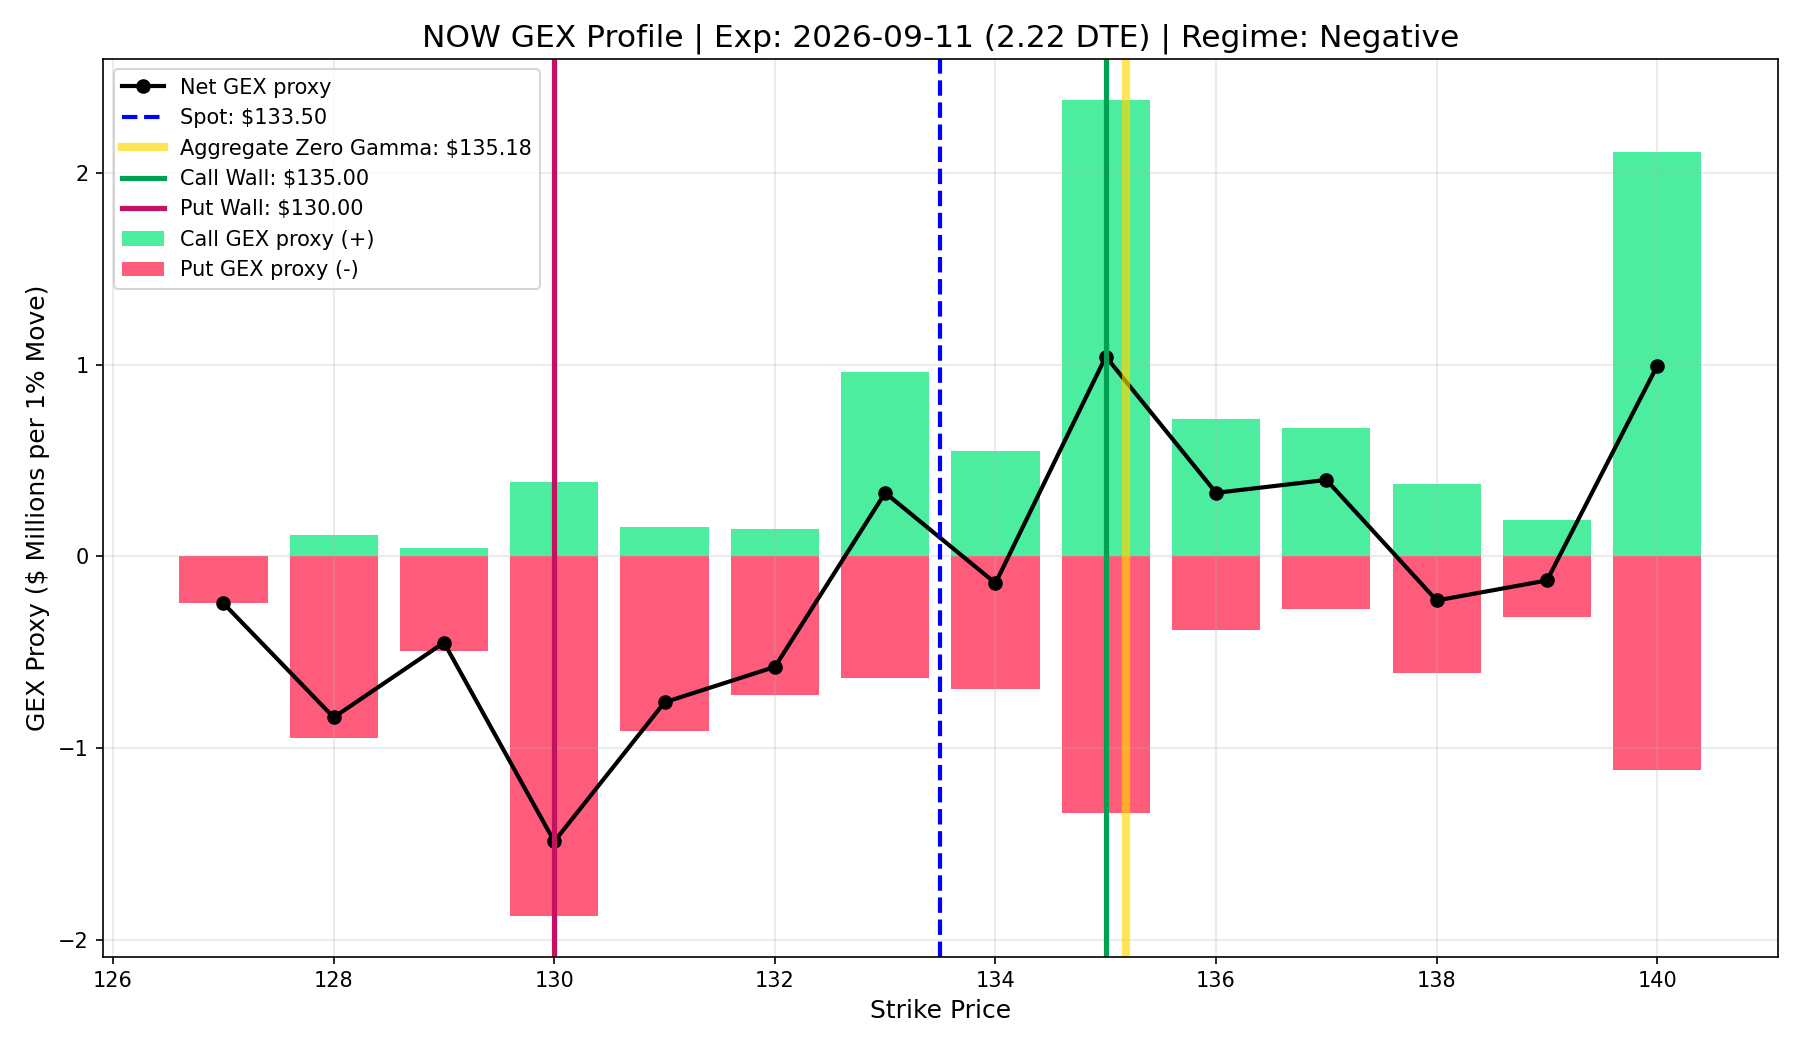
NOW
- Current Price: $154.87
- Call Wall (Resistance): $105.00
- Put Wall (Support): $110.00
- Market Regime: Positive (Dealers Suppressing Volatility)
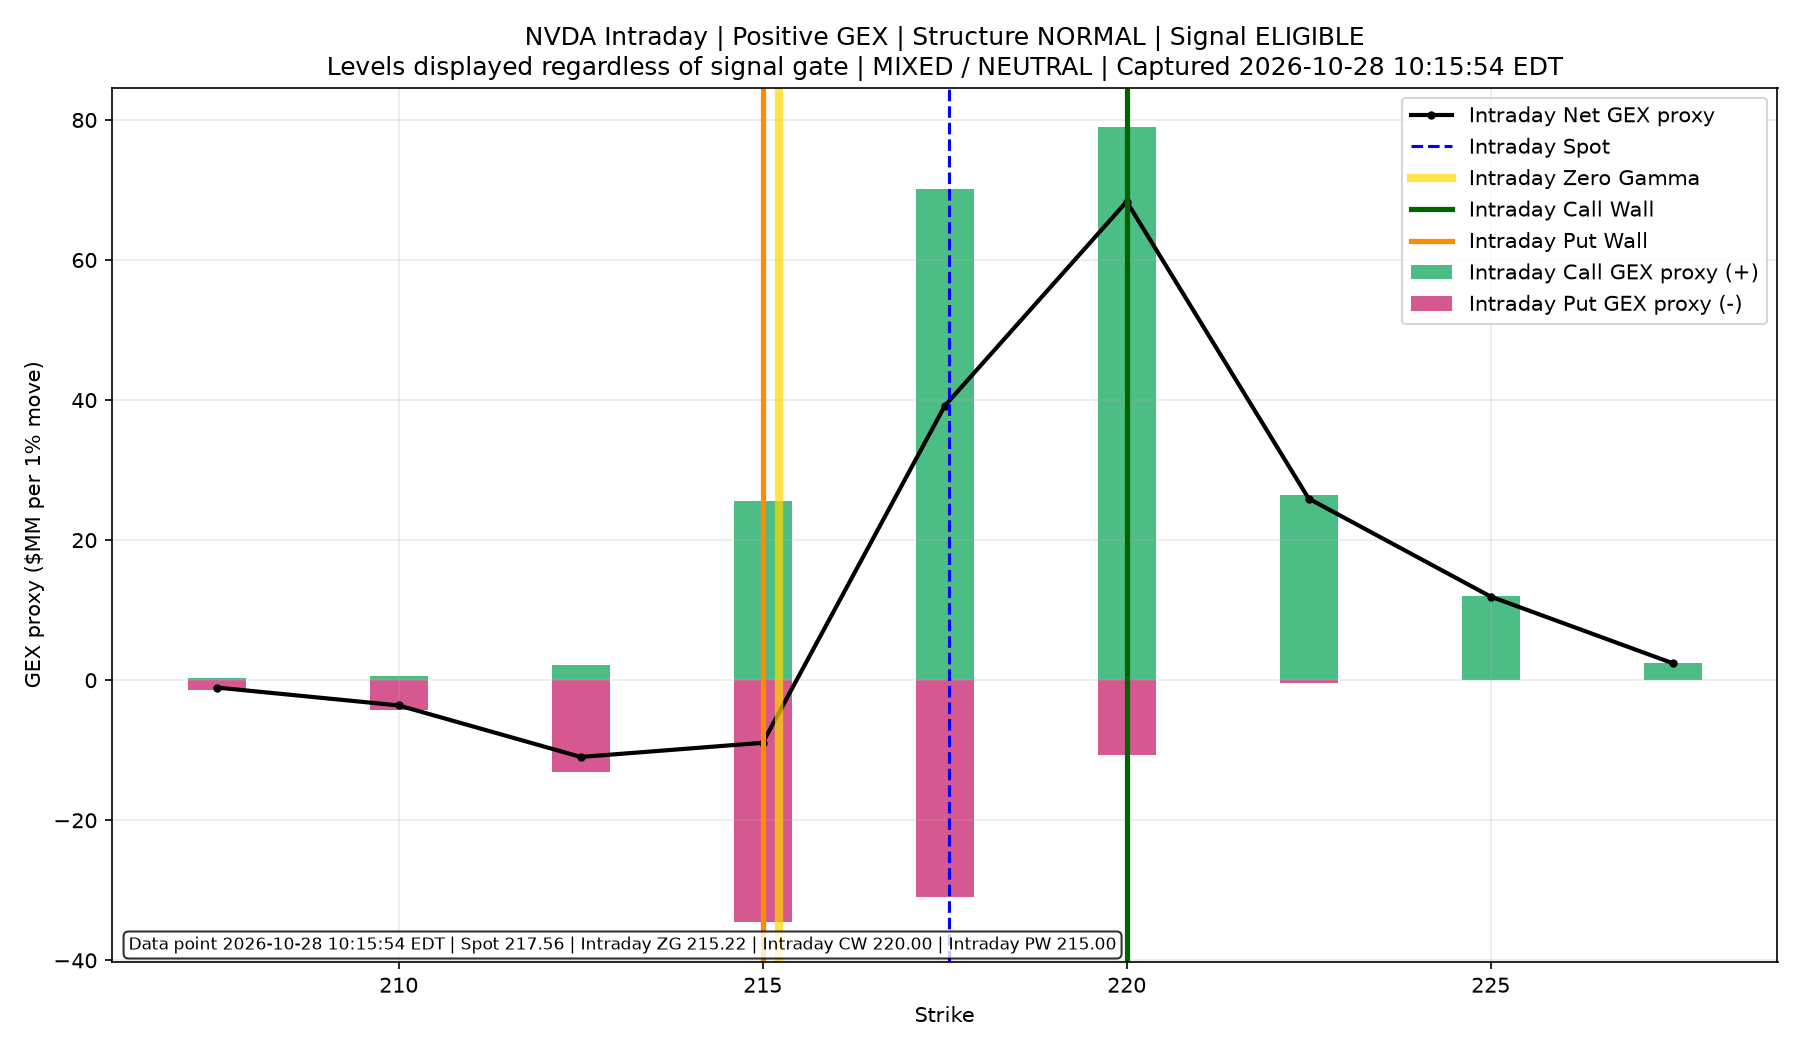
NVDA
- Current Price: $154.87
- Call Wall (Resistance): $197.50
- Put Wall (Support): $200.00
- Market Regime: Negative (Dealers Amplifying Volatility)
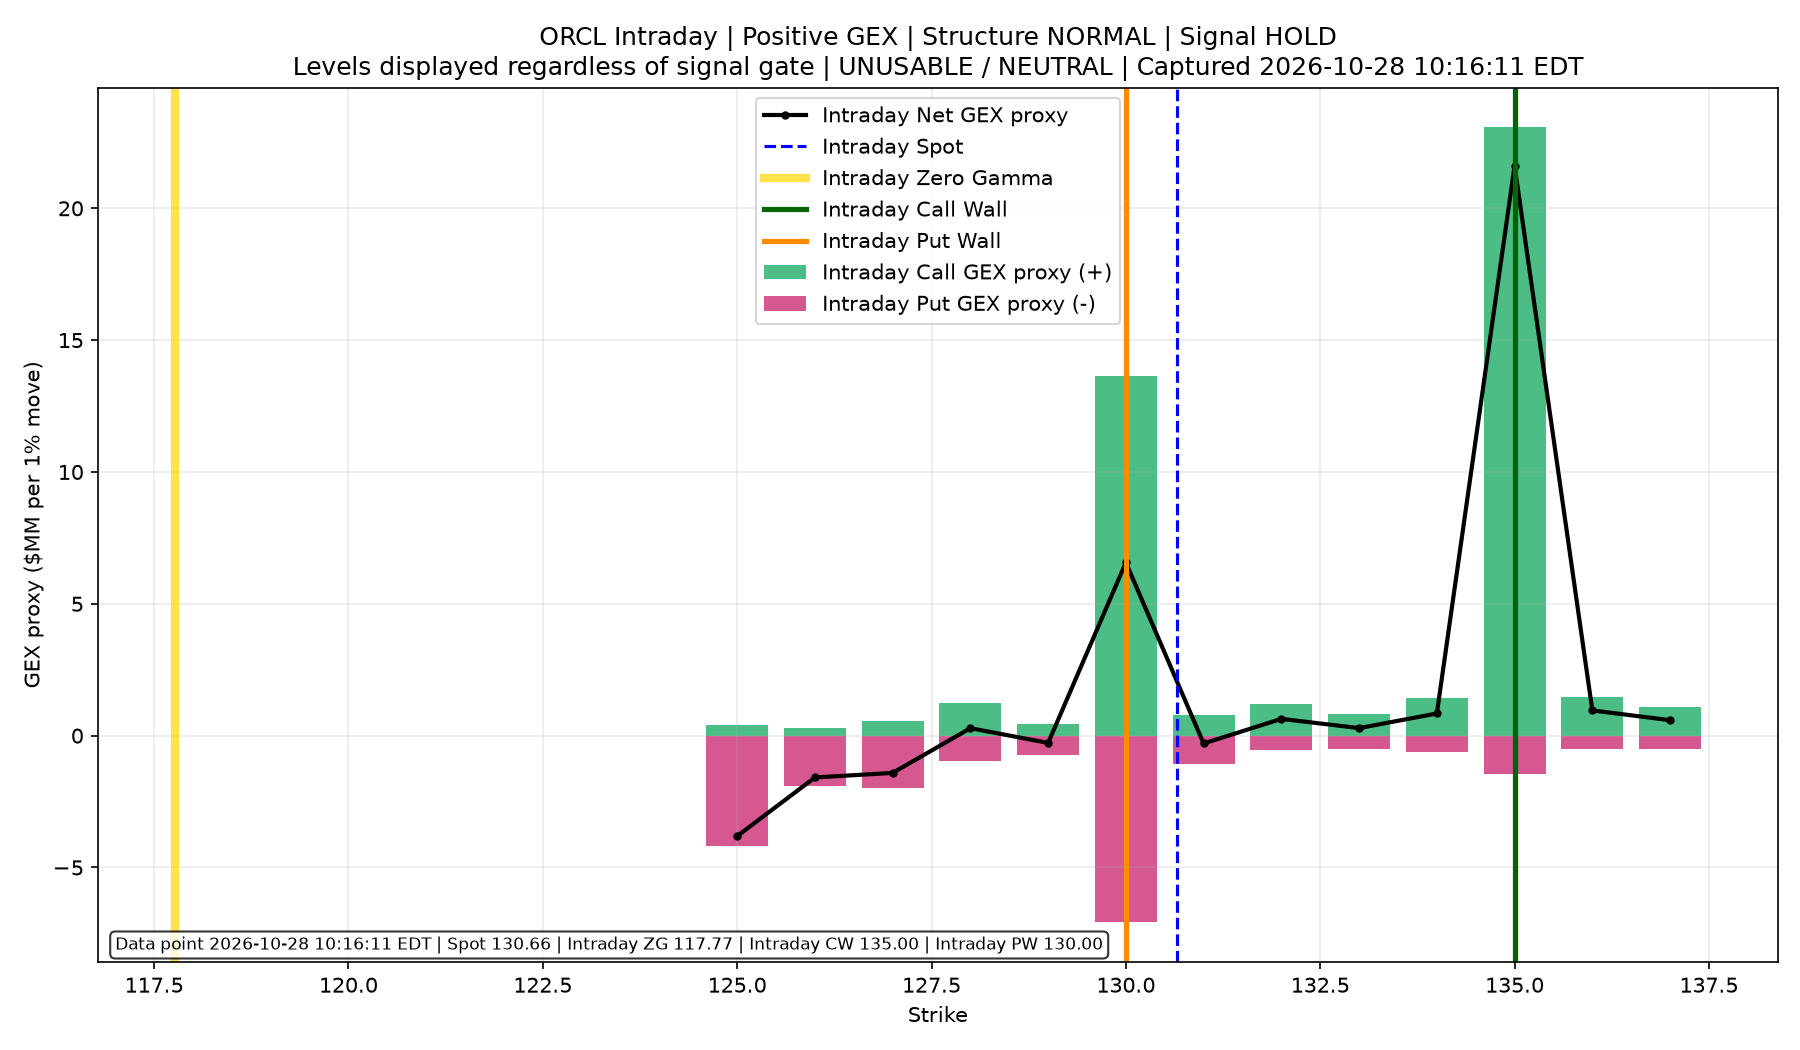
ORCL
- Current Price: $154.87
- Call Wall (Resistance): $125.00
- Put Wall (Support): $120.00
- Market Regime: Negative (Dealers Amplifying Volatility)
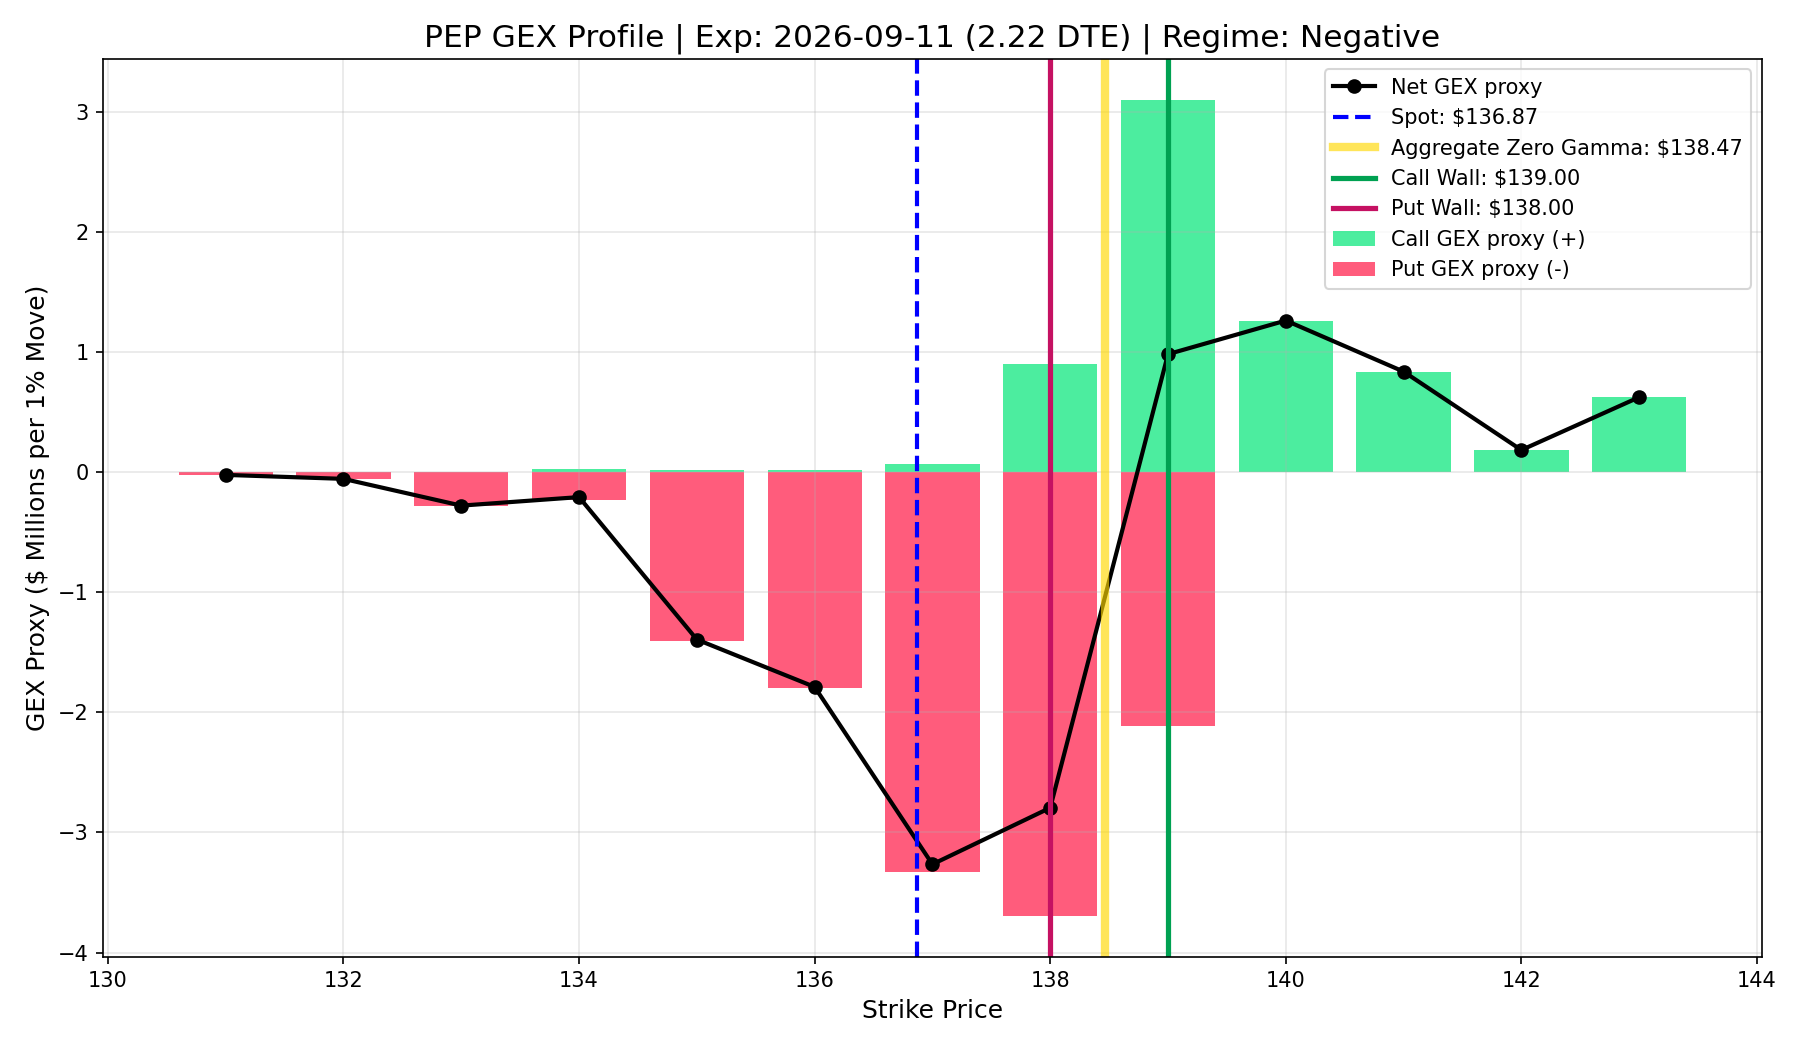
PEP
- Current Price: $154.87
- Call Wall (Resistance): $140.00
- Put Wall (Support): $135.00
- Market Regime: Positive (Dealers Suppressing Volatility)
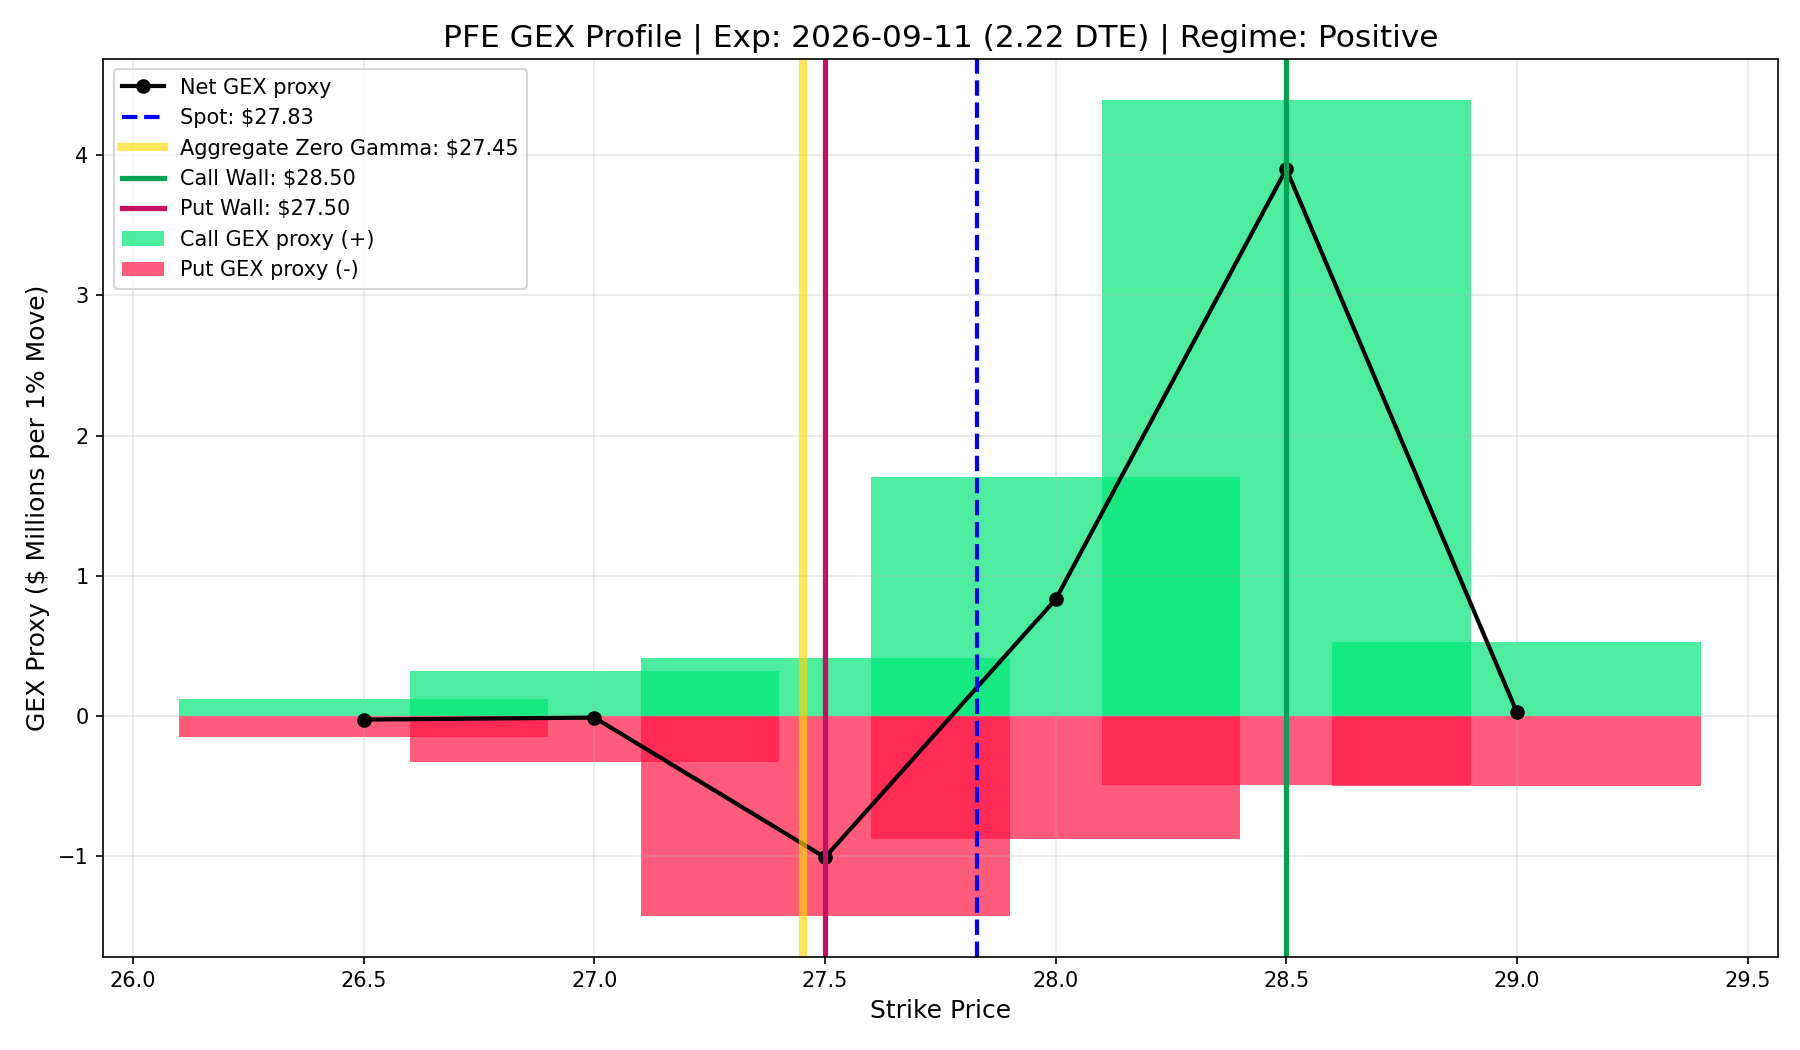
PFE
- Current Price: $154.87
- Call Wall (Resistance): $25.00
- Put Wall (Support): $24.00
- Market Regime: Negative (Dealers Amplifying Volatility)
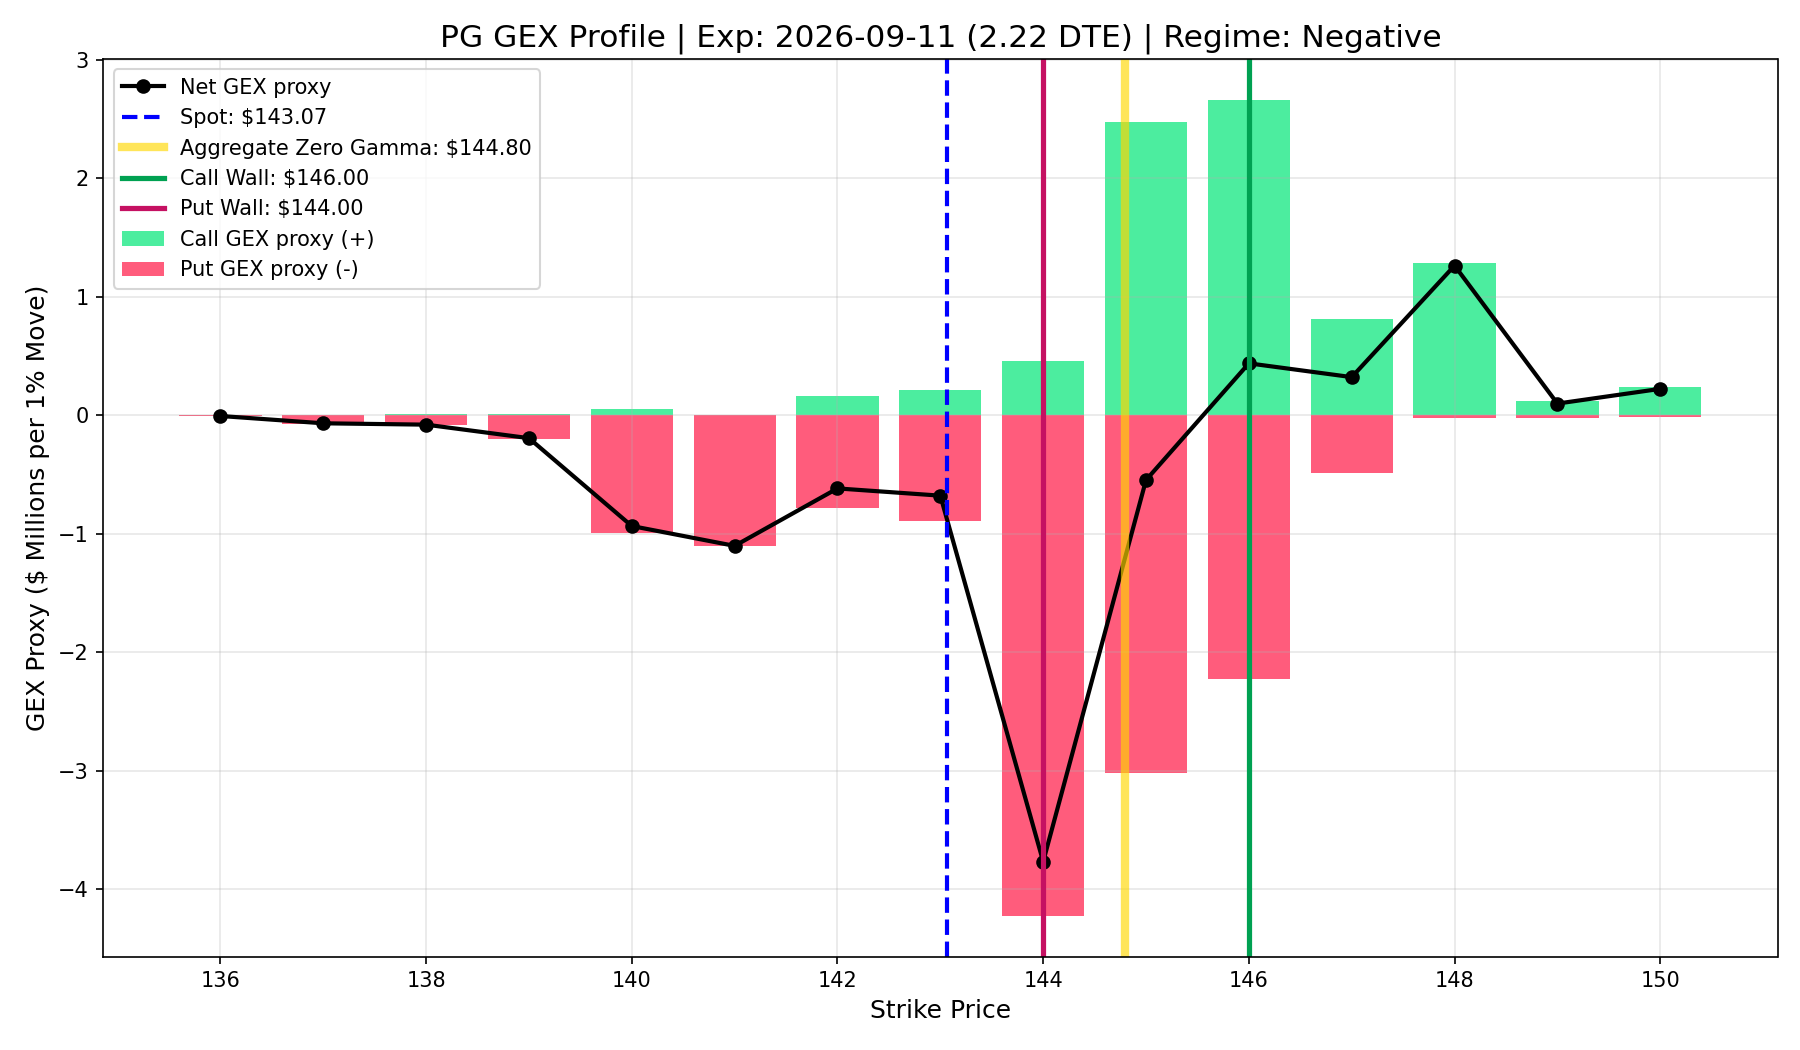
PG
- Current Price: $154.87
- Call Wall (Resistance): $152.50
- Put Wall (Support): $145.00
- Market Regime: Positive (Dealers Suppressing Volatility)
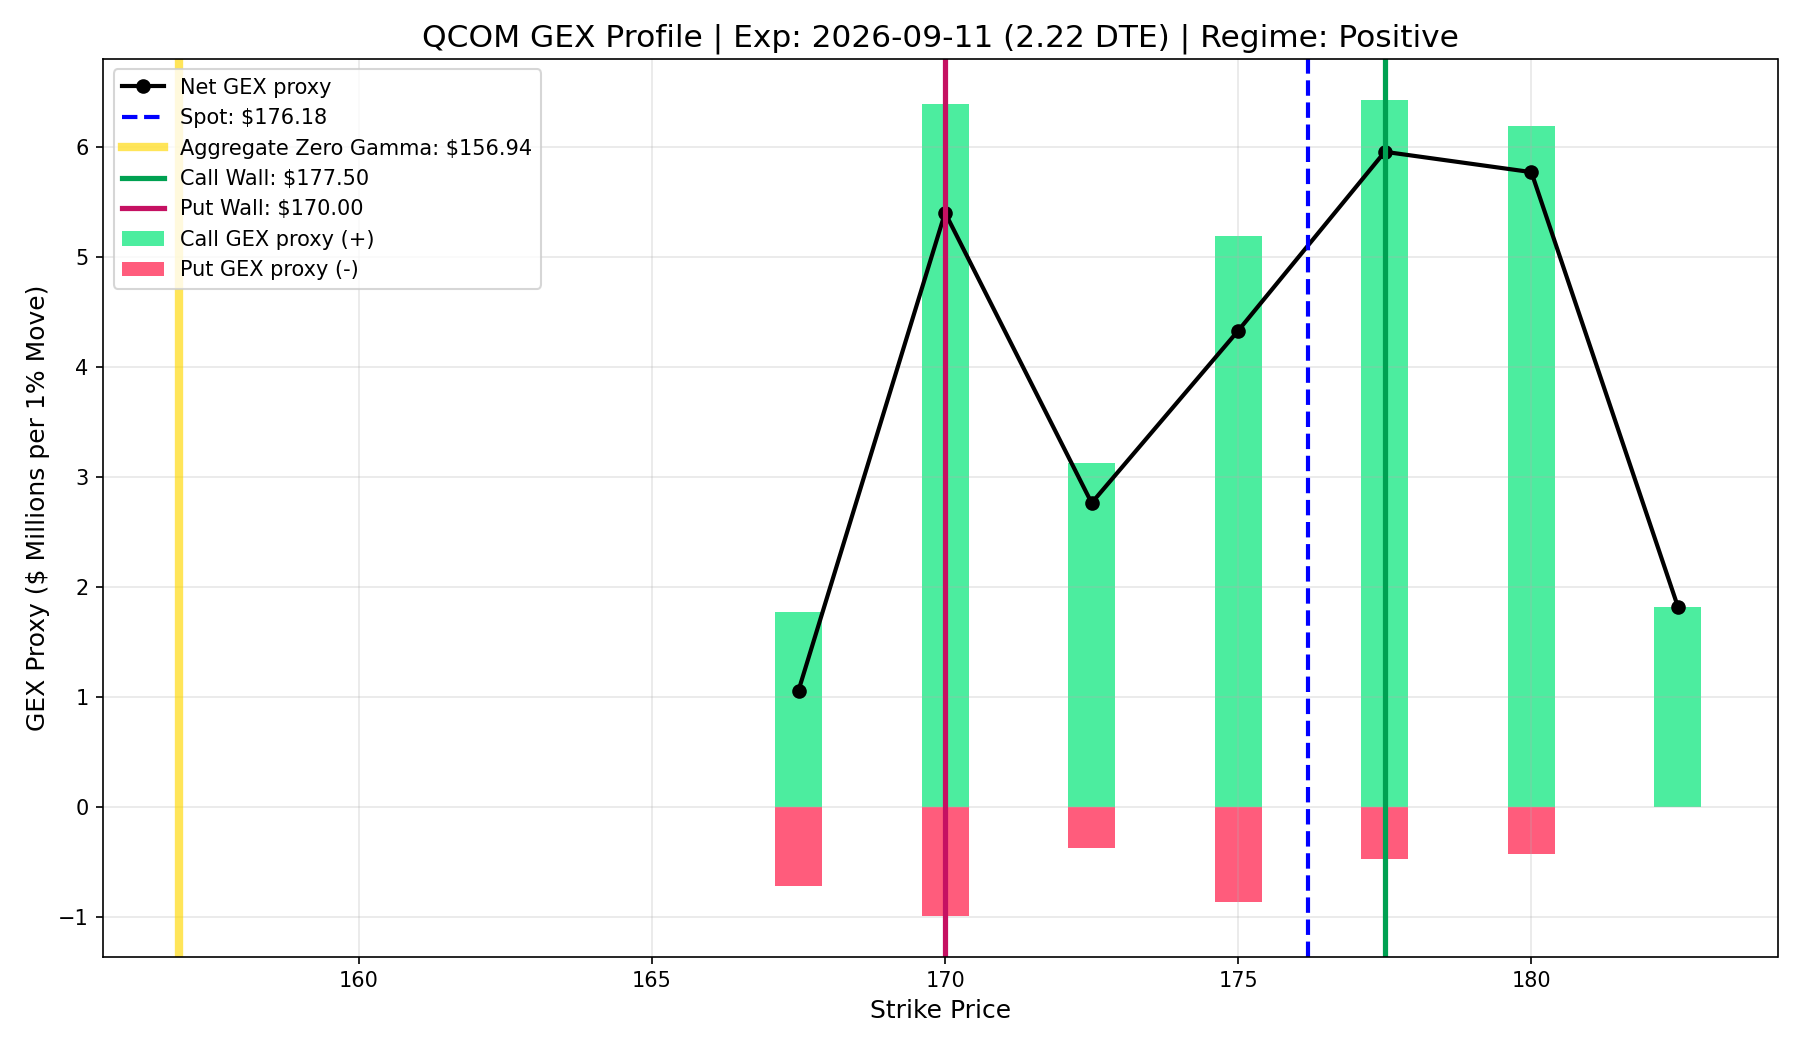
QCOM
- Current Price: $154.87
- Call Wall (Resistance): $177.50
- Put Wall (Support): $170.00
- Market Regime: Positive (Dealers Suppressing Volatility)
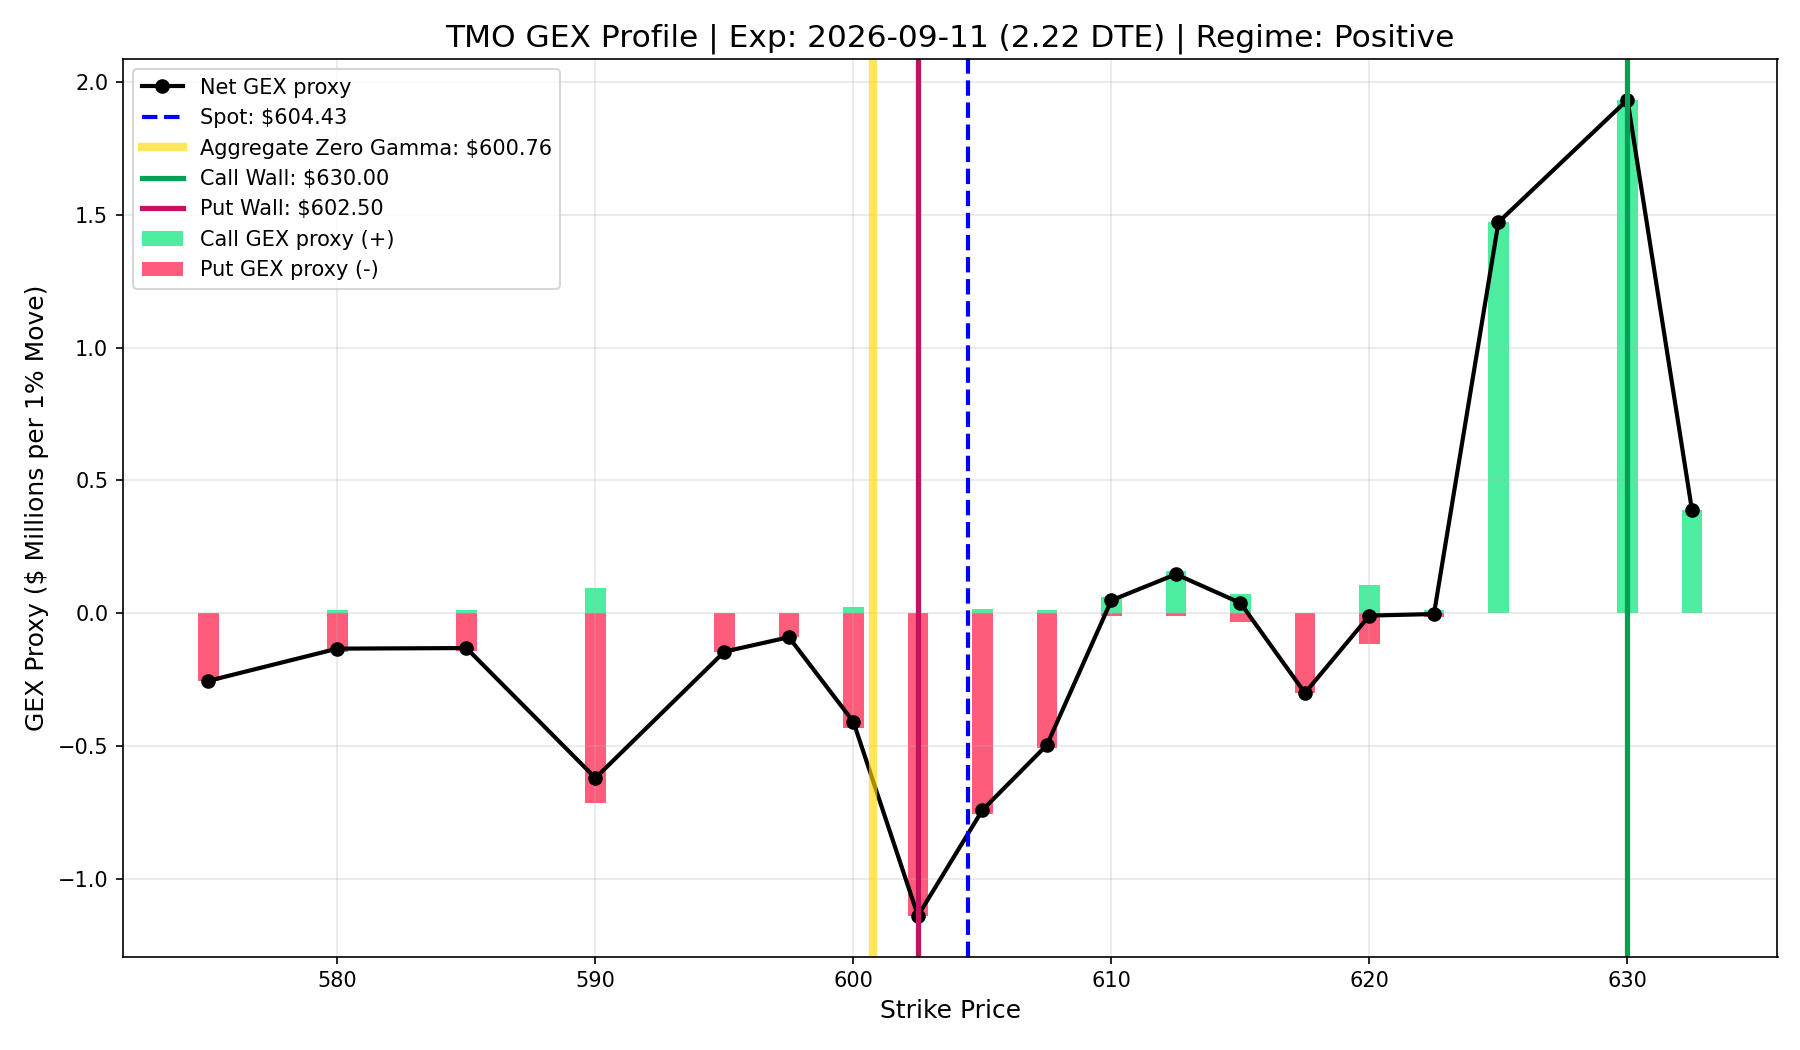
TMO
- Current Price: $154.87
- Call Wall (Resistance): $575.00
- Put Wall (Support): $550.00
- Market Regime: Negative (Dealers Amplifying Volatility)
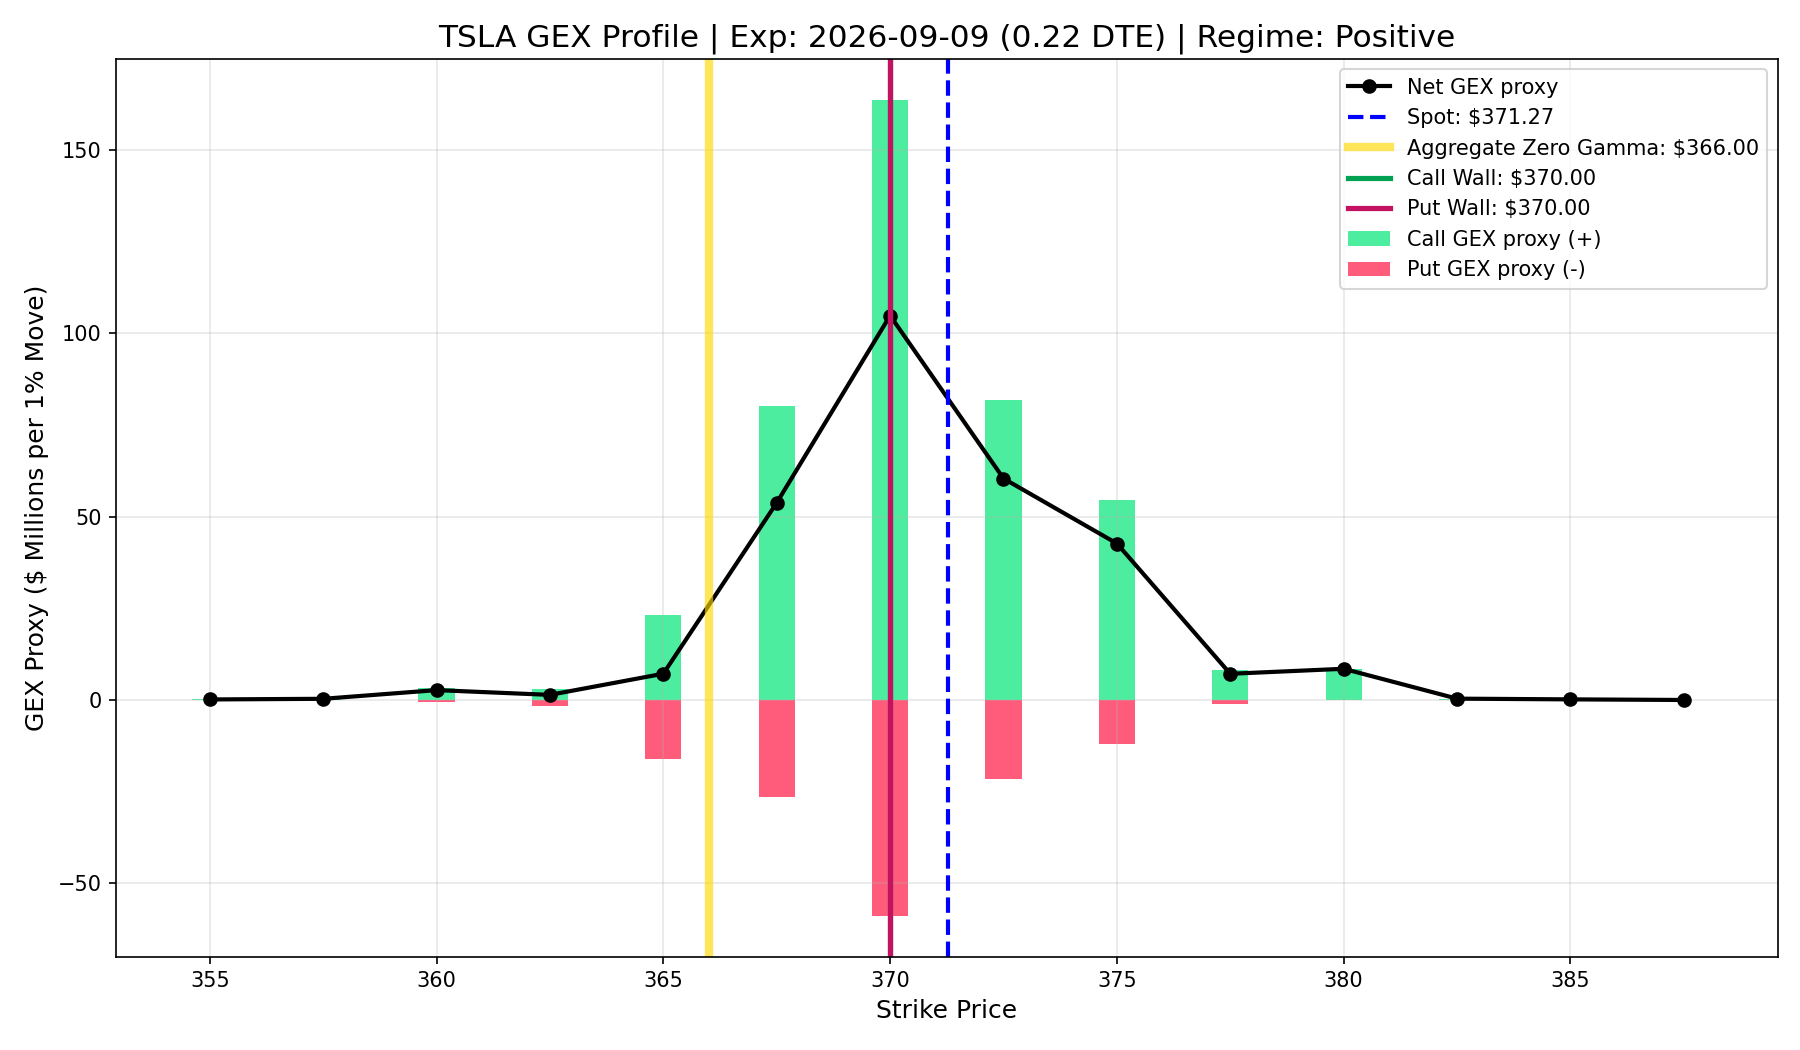
TSLA
- Current Price: $154.87
- Call Wall (Resistance): $310.00
- Put Wall (Support): $310.00
- Market Regime: Negative (Dealers Amplifying Volatility)
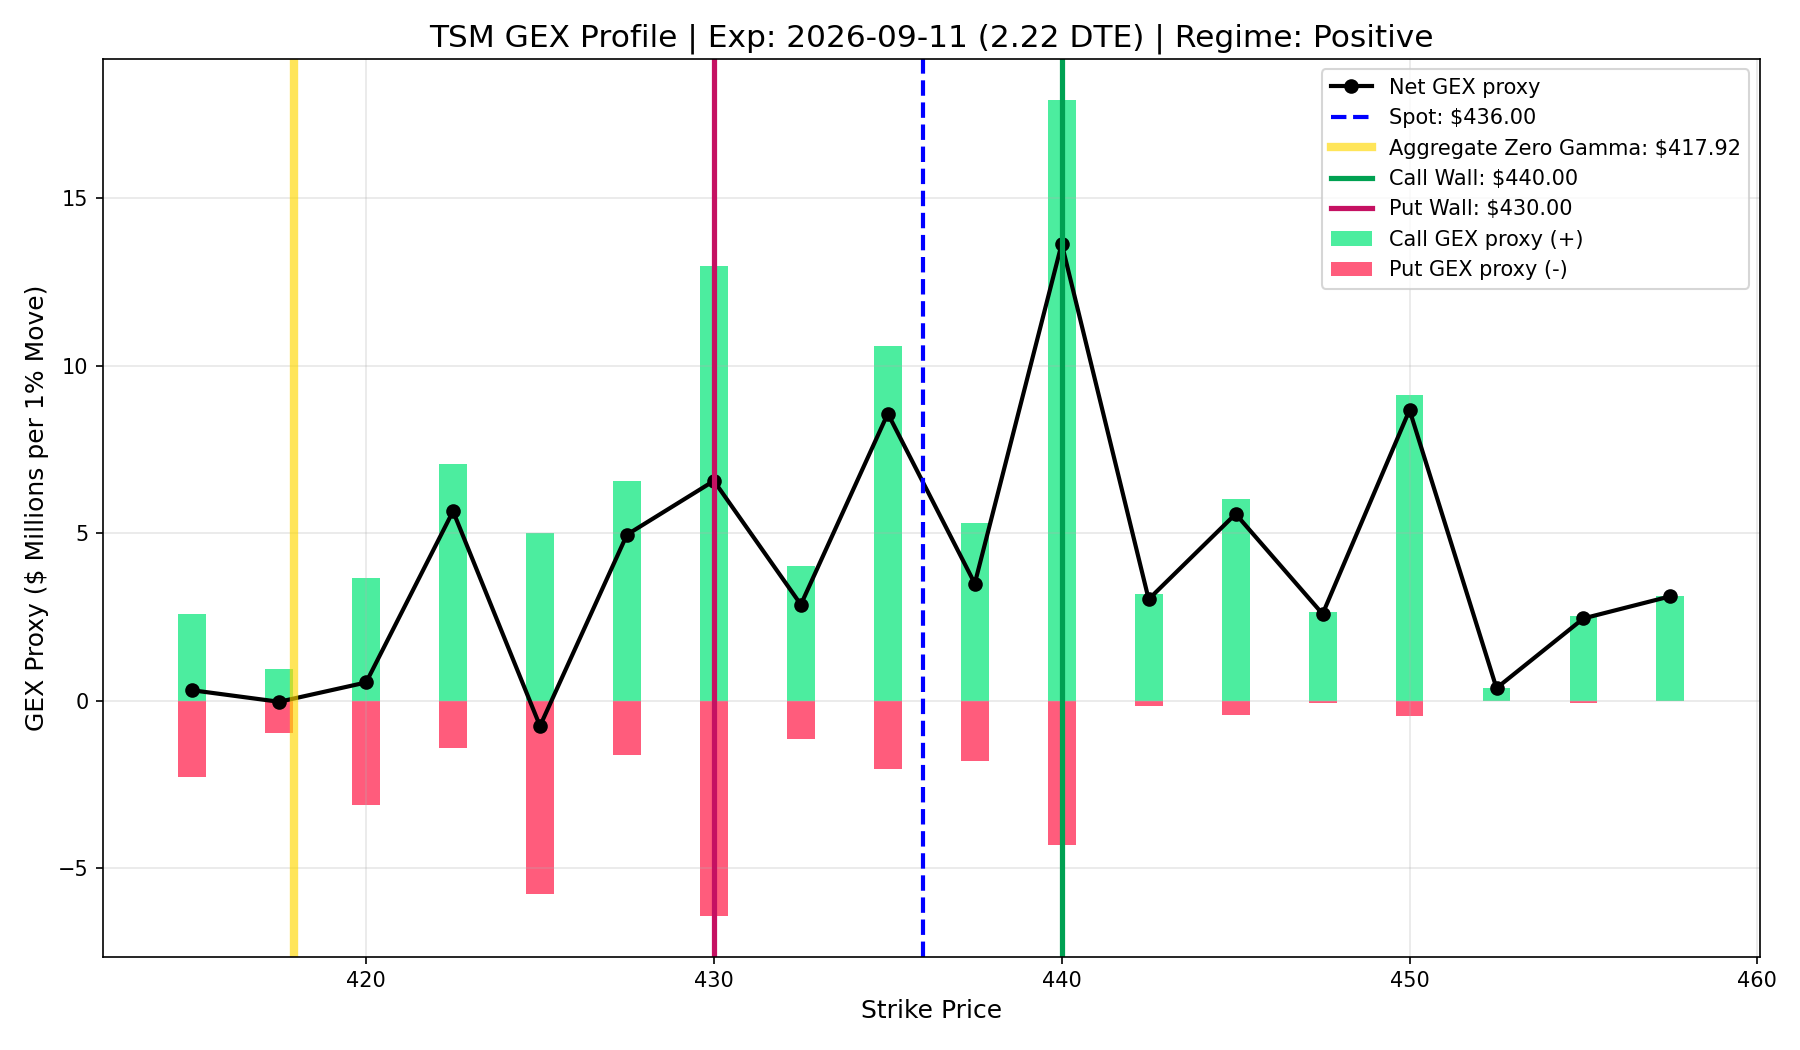
TSM
- Current Price: $154.87
- Call Wall (Resistance): $400.00
- Put Wall (Support): $400.00
- Market Regime: Negative (Dealers Amplifying Volatility)
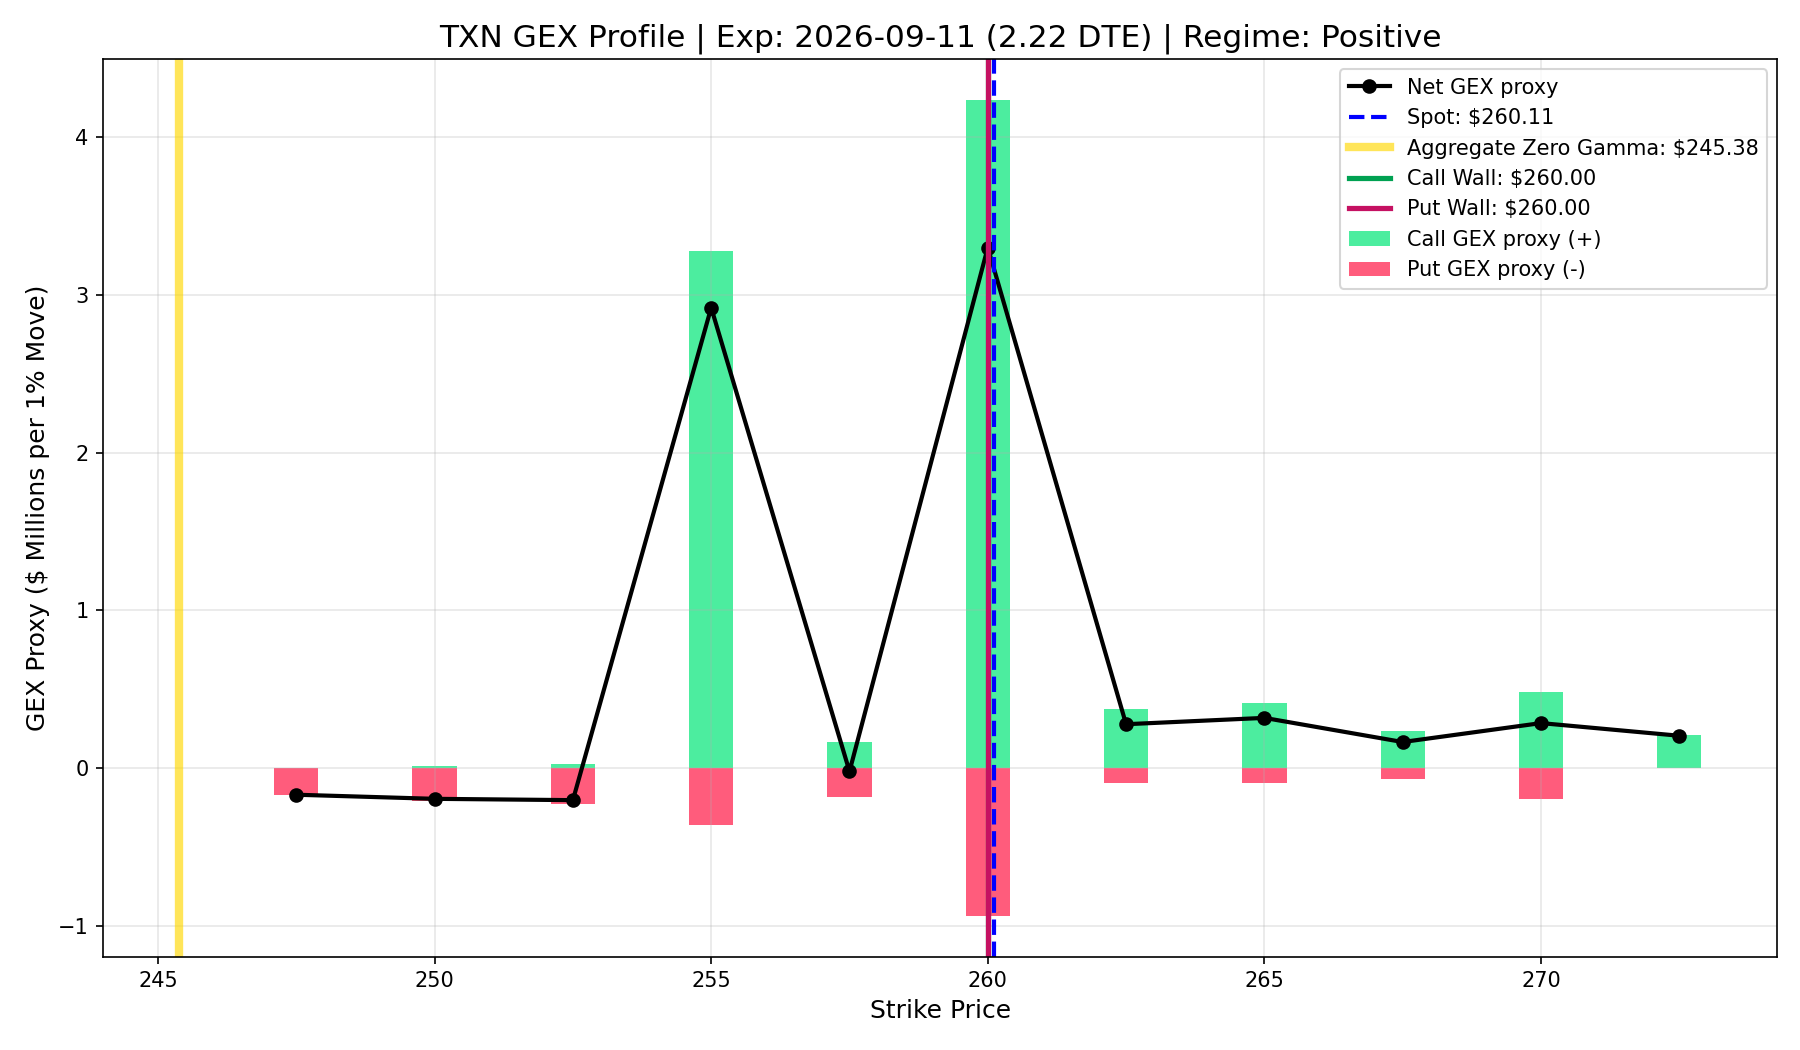
TXN
- Current Price: $154.87
- Call Wall (Resistance): $287.50
- Put Wall (Support): $270.00
- Market Regime: Positive (Dealers Suppressing Volatility)
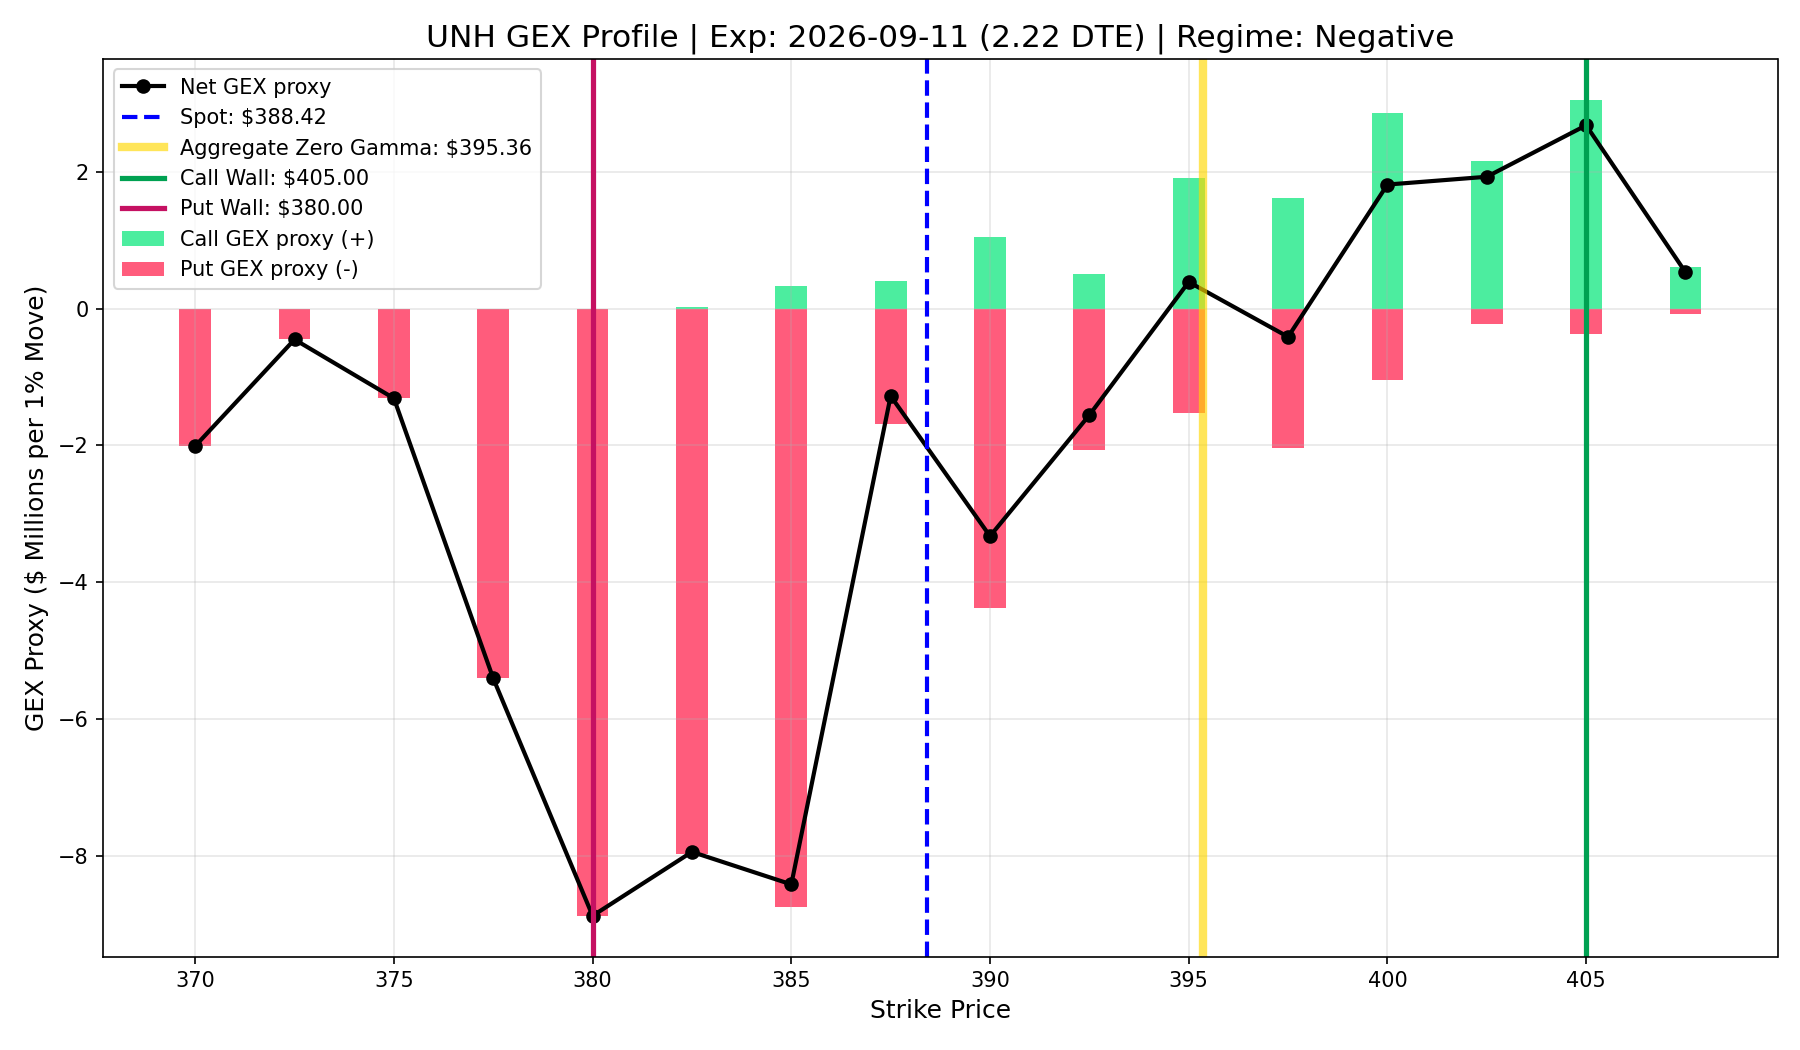
UNH
- Current Price: $154.87
- Call Wall (Resistance): $430.00
- Put Wall (Support): $410.00
- Market Regime: Positive (Dealers Suppressing Volatility)
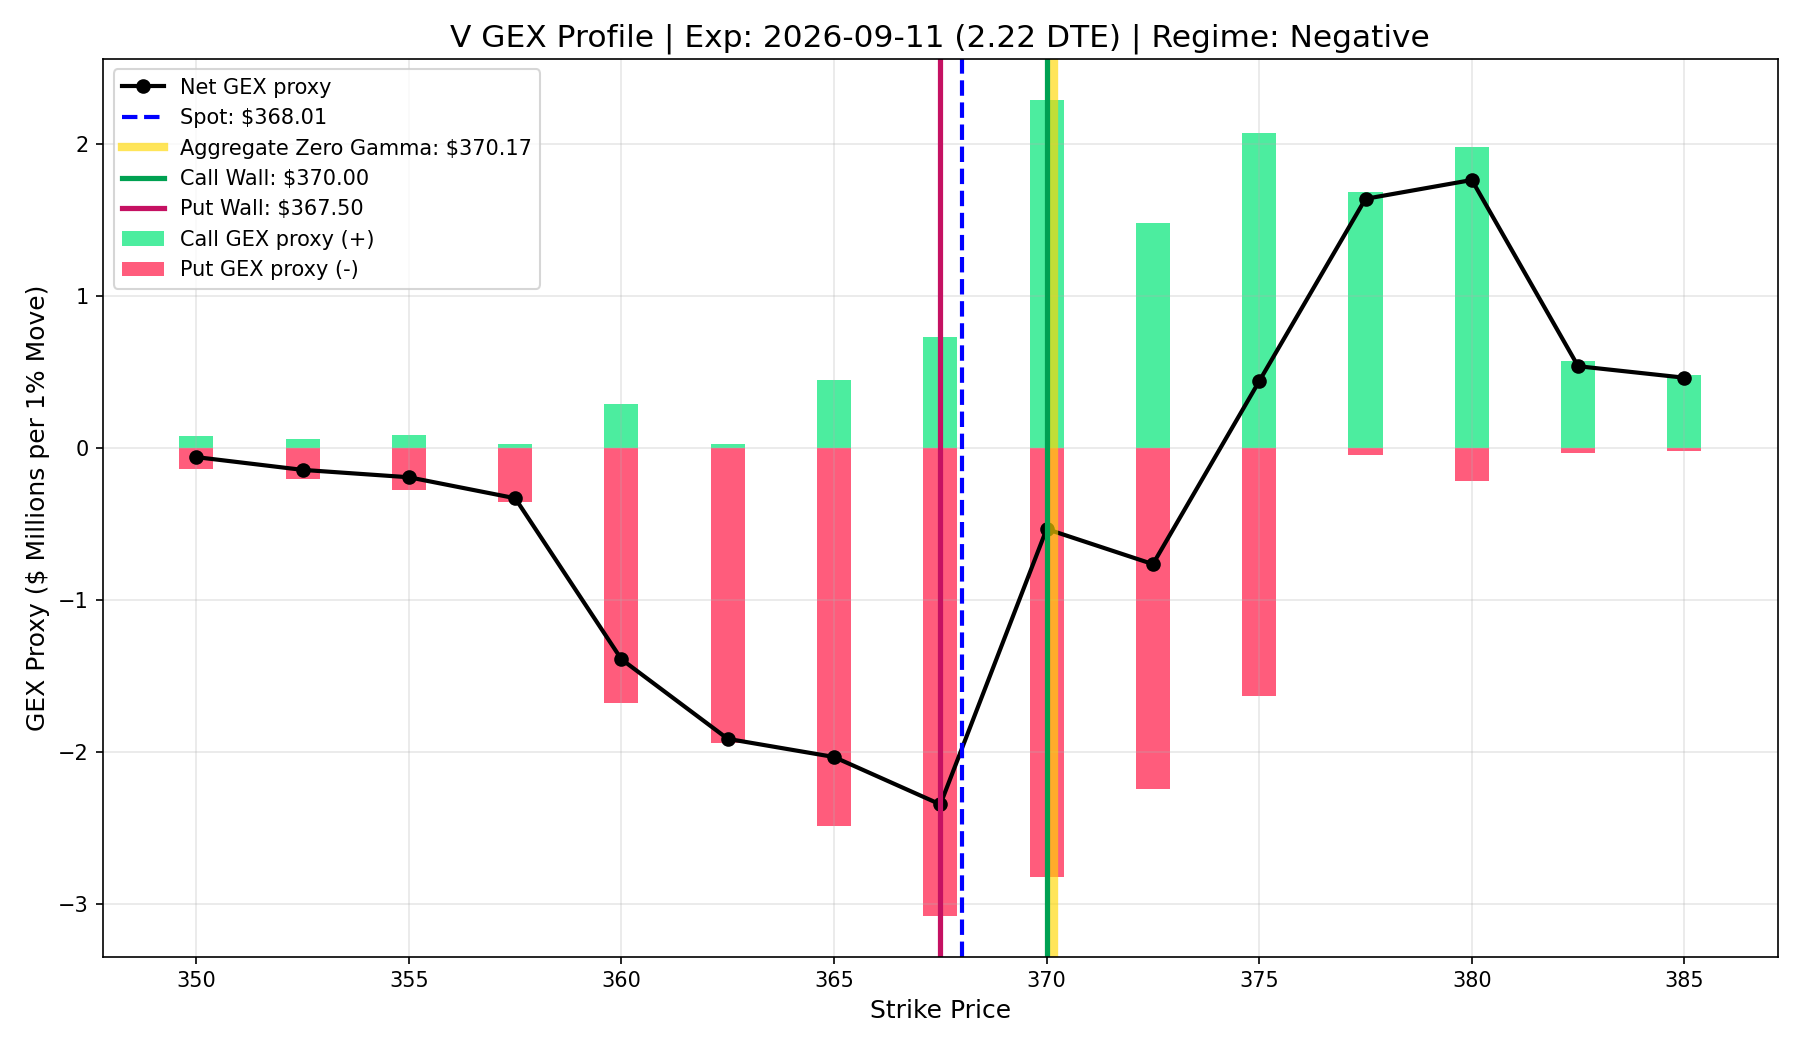
V
- Current Price: $154.87
- Call Wall (Resistance): $360.00
- Put Wall (Support): $355.00
- Market Regime: Positive (Dealers Suppressing Volatility)
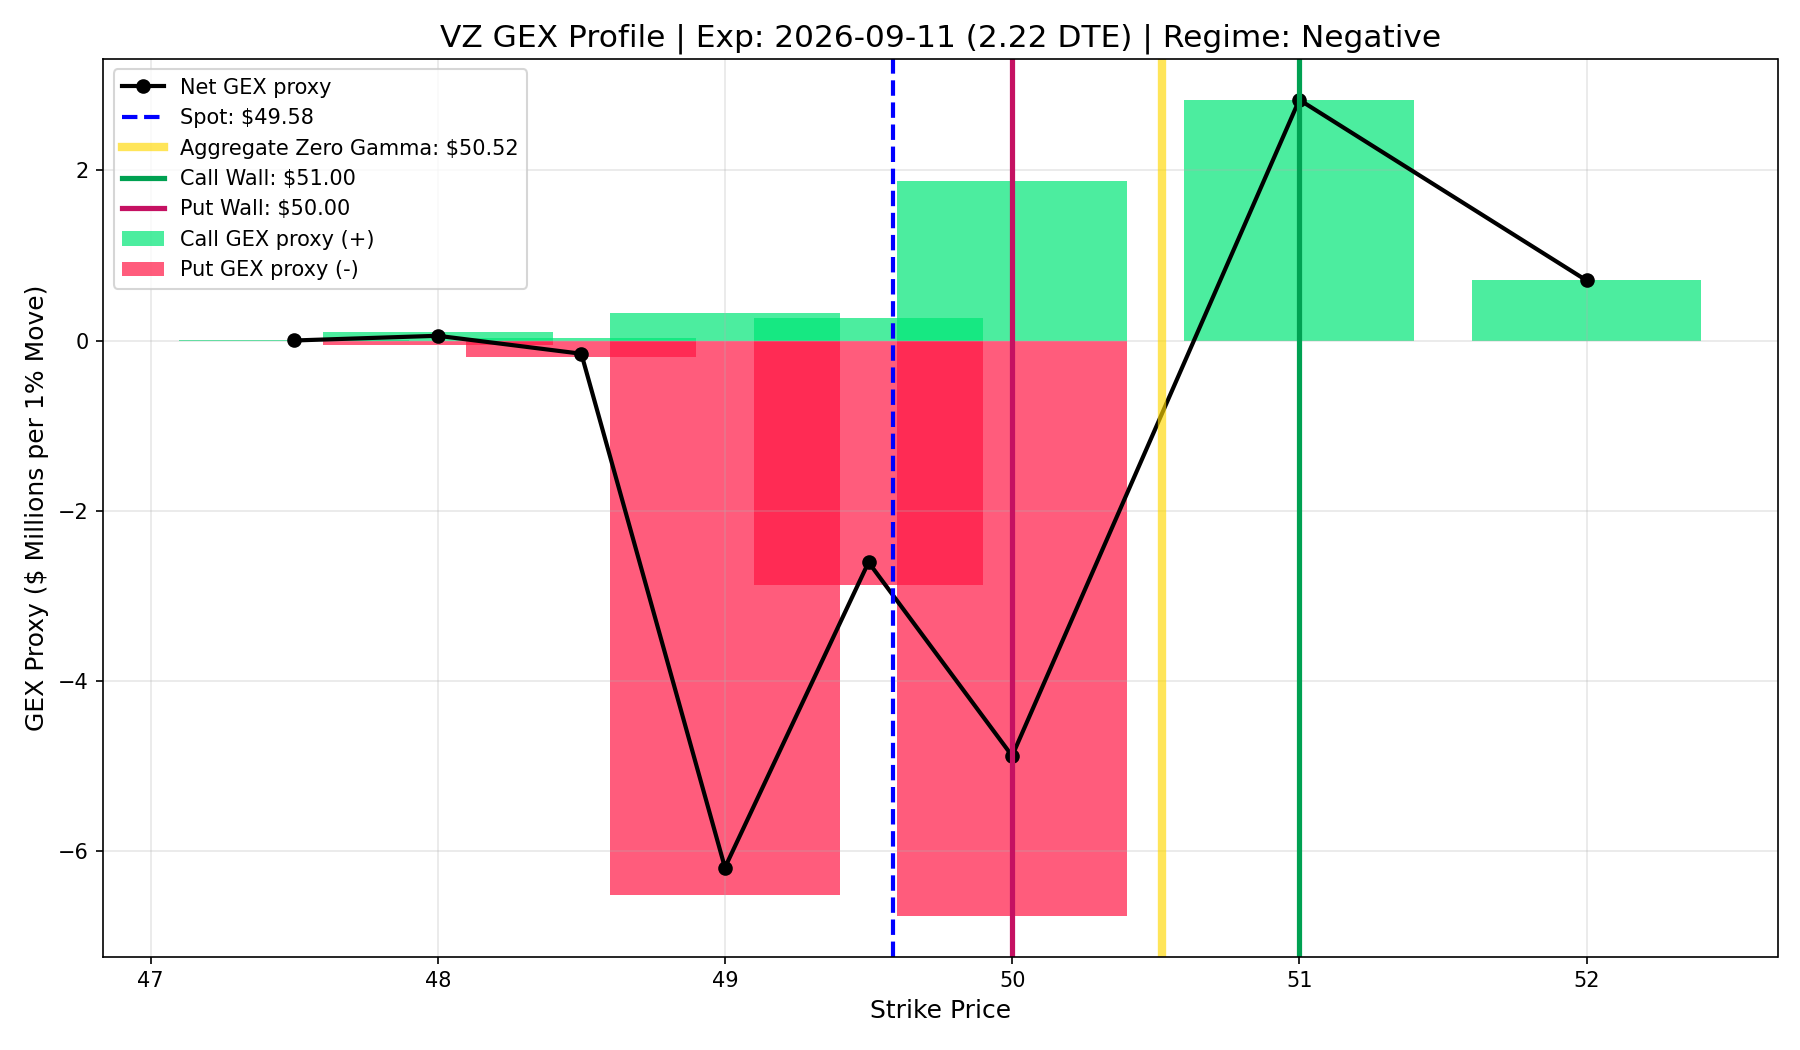
VZ
- Current Price: $154.87
- Call Wall (Resistance): $46.00
- Put Wall (Support): $45.50
- Market Regime: Positive (Dealers Suppressing Volatility)
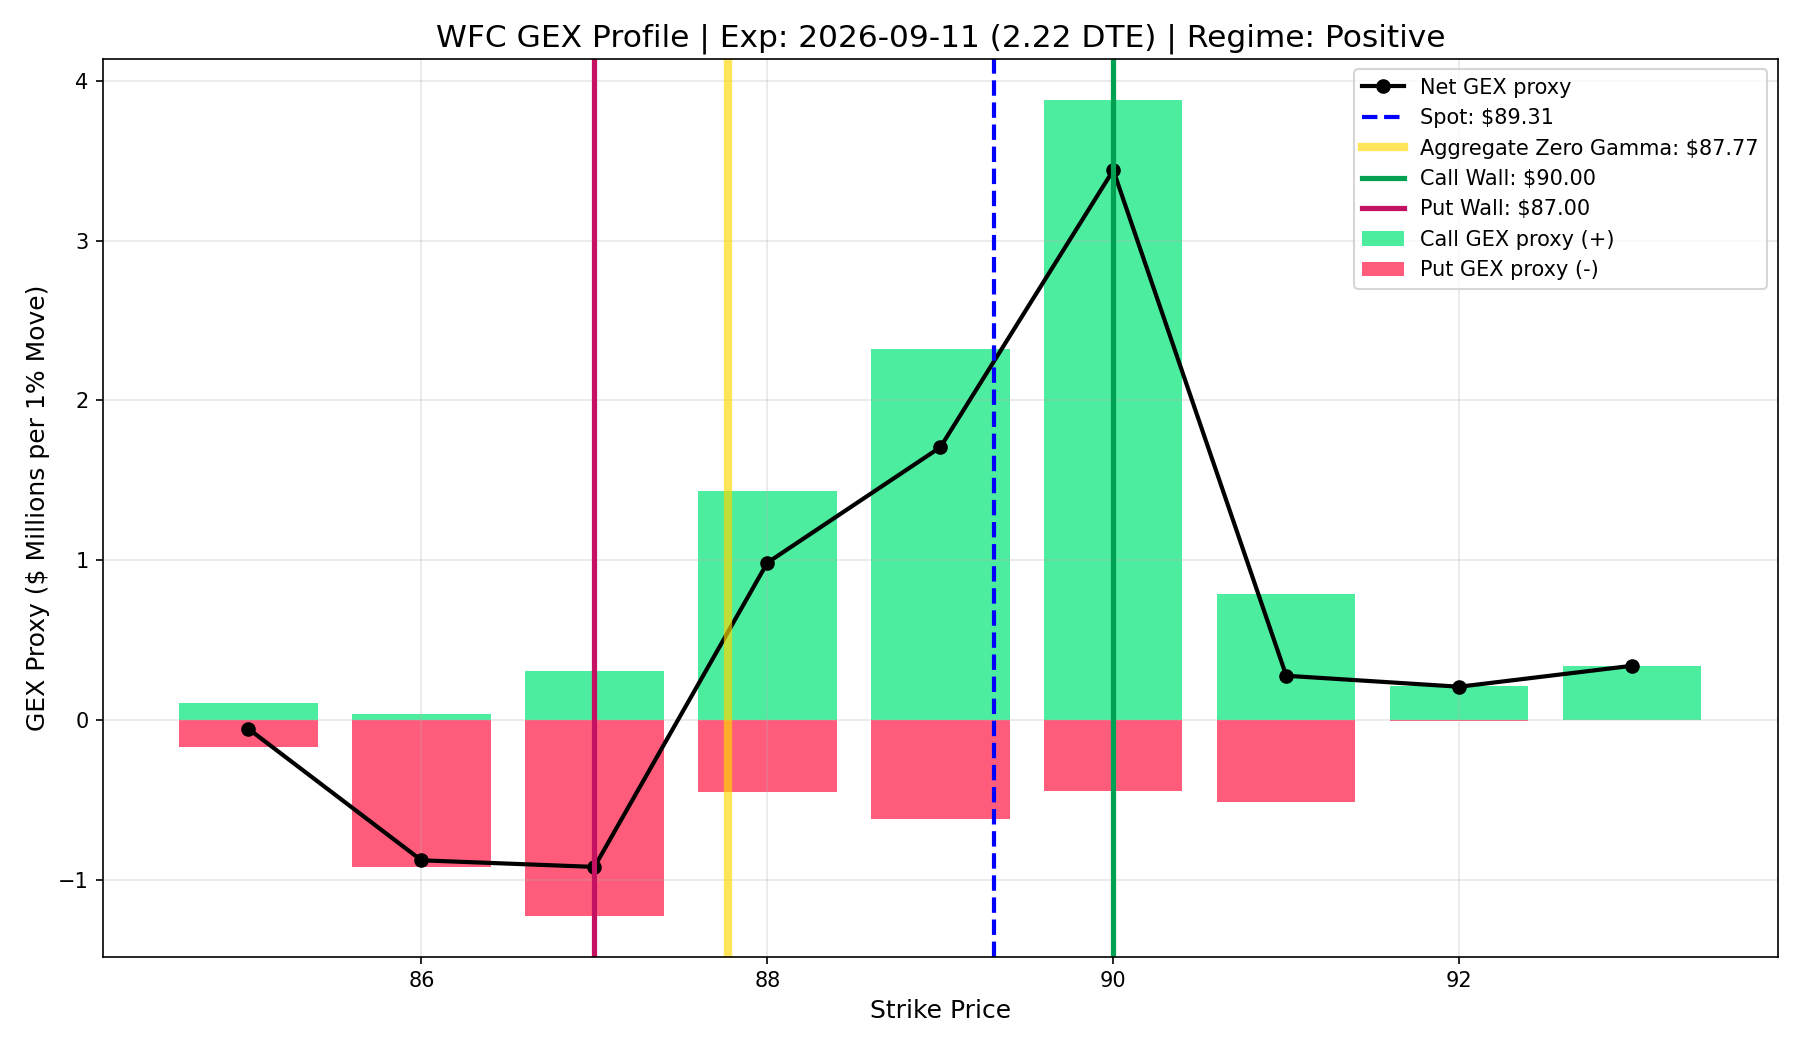
WFC
- Current Price: $154.87
- Call Wall (Resistance): $87.00
- Put Wall (Support): $86.00
- Market Regime: Positive (Dealers Suppressing Volatility)
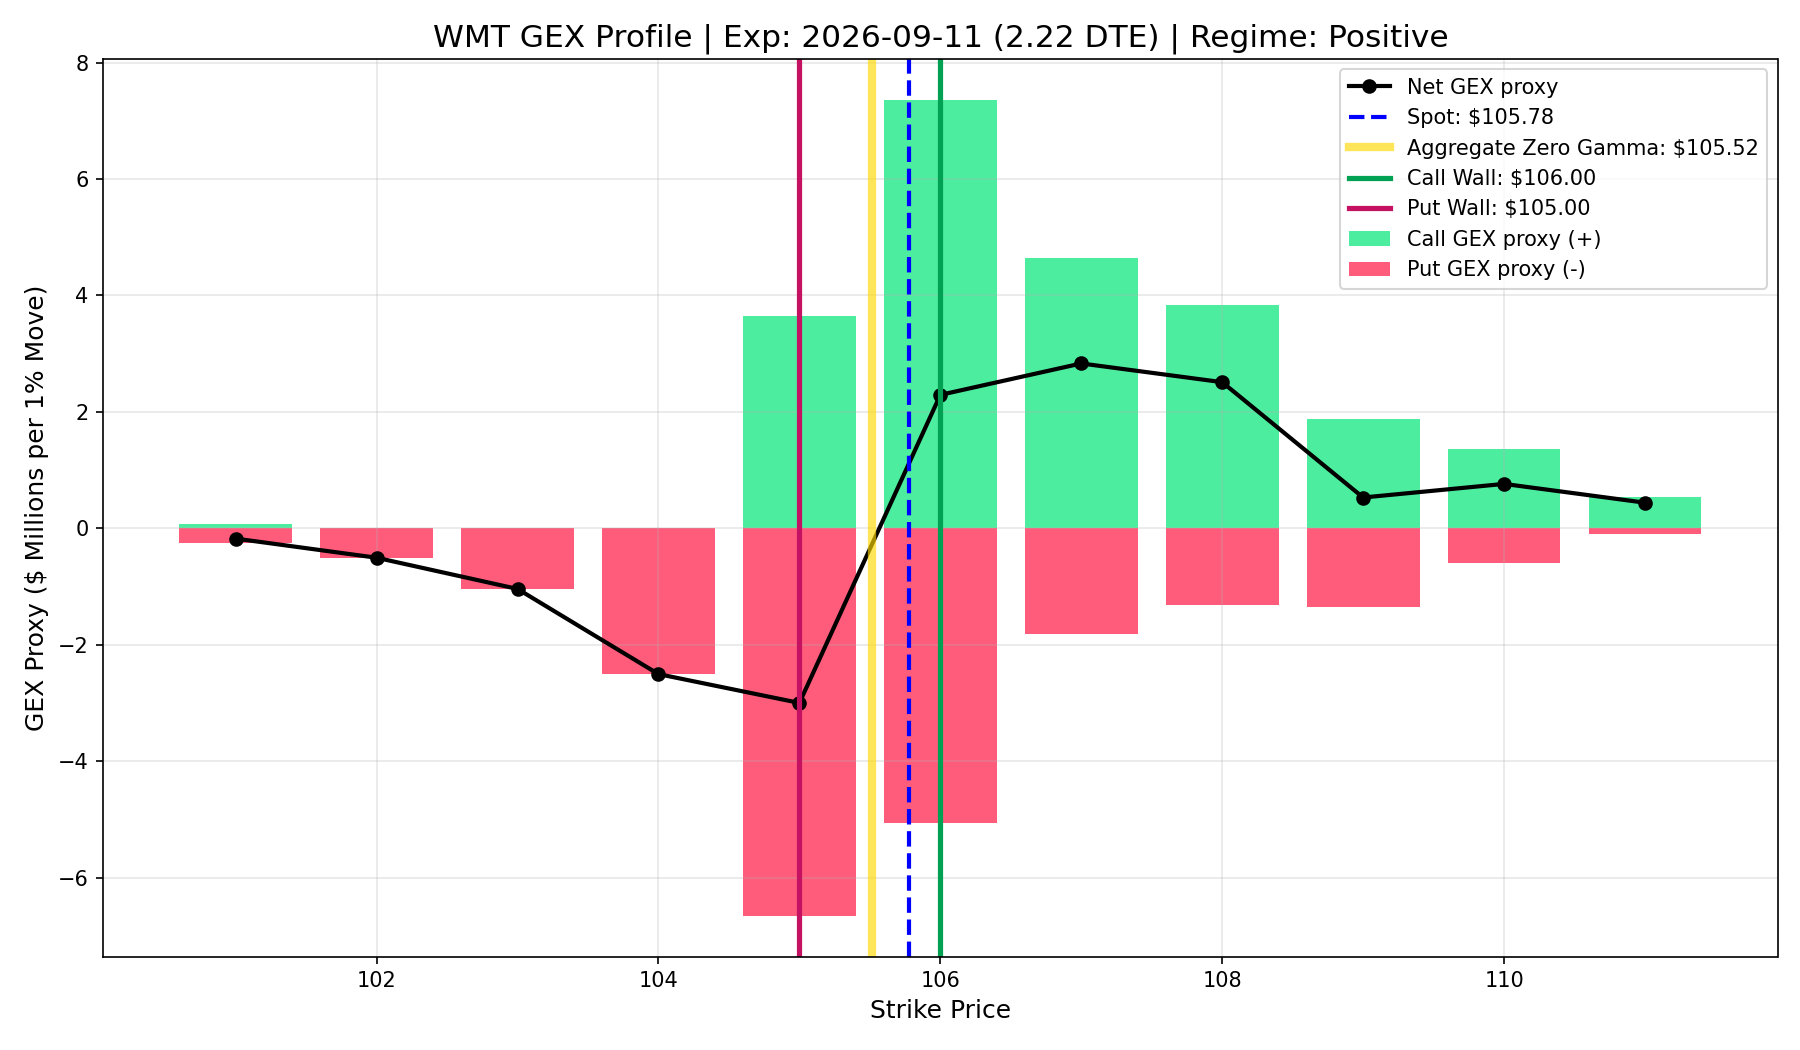
WMT
- Current Price: $154.87
- Call Wall (Resistance): $110.00
- Put Wall (Support): $111.00
- Market Regime: Negative (Dealers Amplifying Volatility)
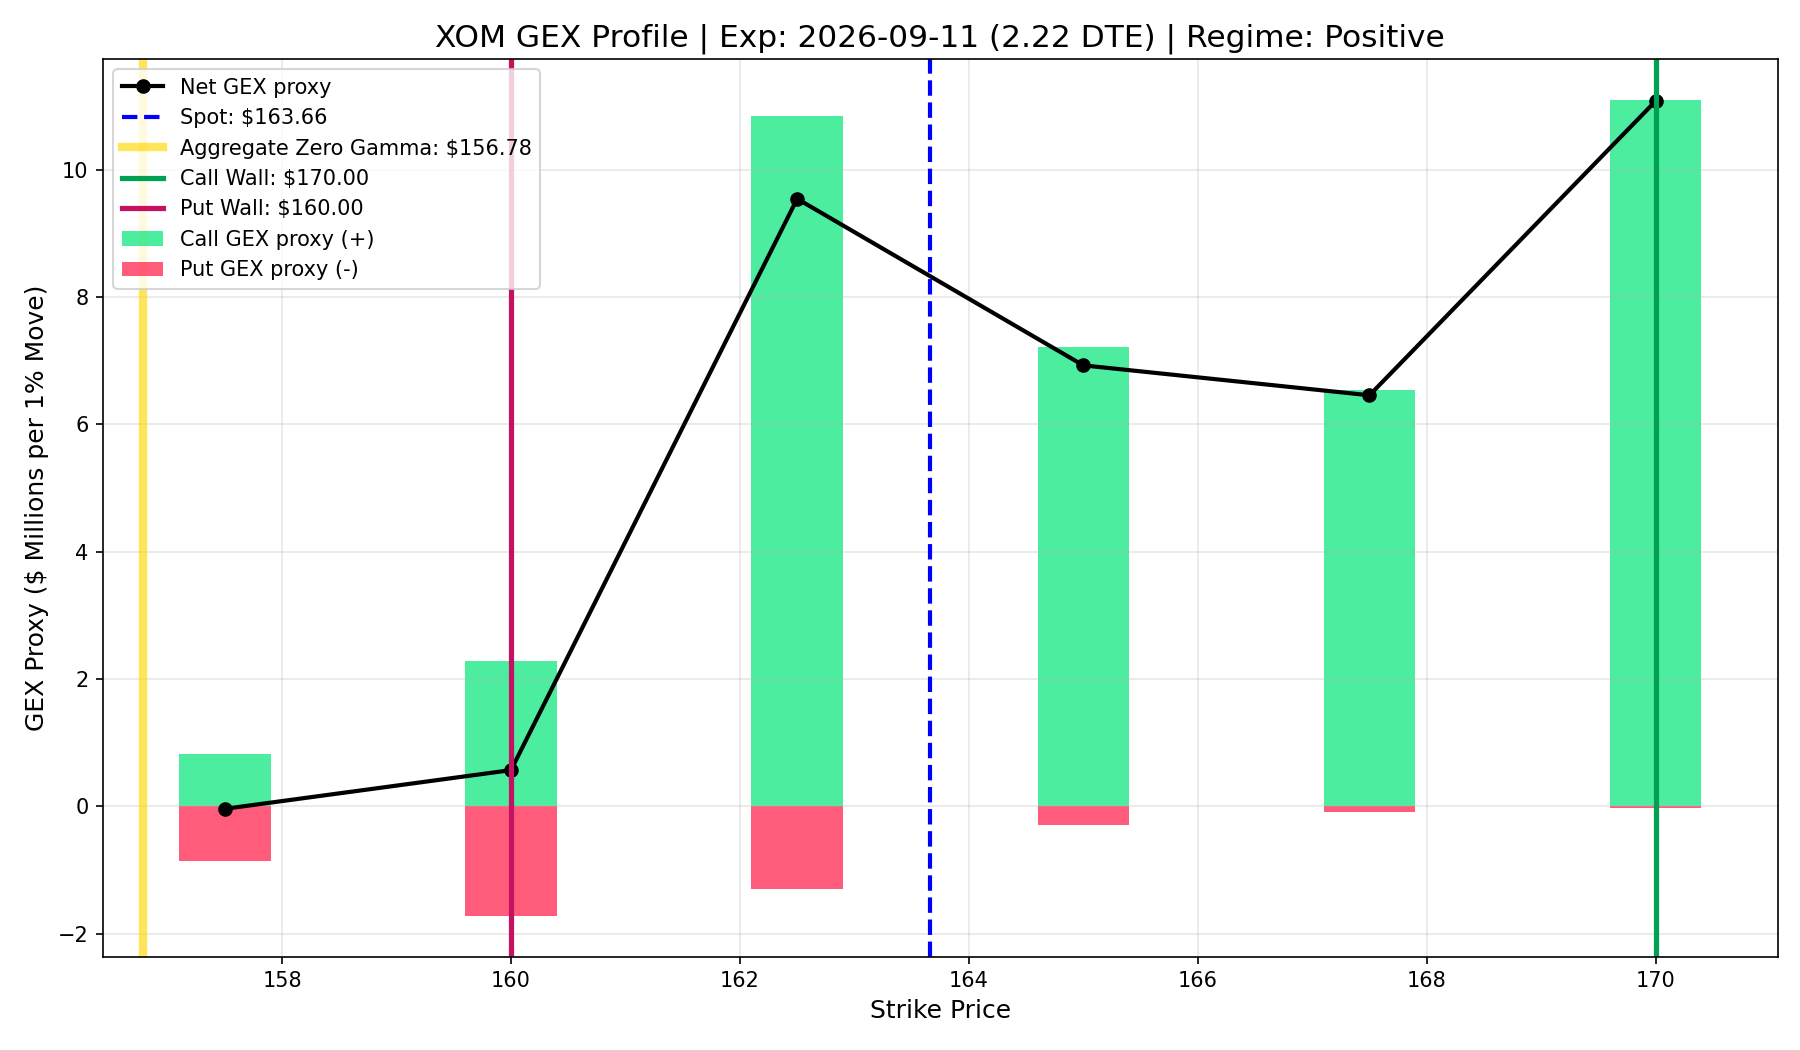
XOM
- Current Price: $154.87
- Call Wall (Resistance): $160.00
- Put Wall (Support): $155.00
- Market Regime: Positive (Dealers Suppressing Volatility)
Disclaimer: Use of Data Source and Data Accuracy
The information and data presented in this analysis are sourced from publicly available data and are intended for informational purposes only. The data used in this analysis is obtained from various sources, including but not limited to Yahoo Finance, and may be subject to terms of use and restrictions set by those sources.
It is important to note that while efforts have been made to ensure the accuracy and reliability of the data presented, there is no guarantee of its accuracy, completeness, or timeliness. The data used in this analysis may be subject to change and may not reflect the most up-to-date information.
Users are advised to exercise caution and perform due diligence when making any financial decisions based on the information presented in this analysis. We do not endorse or recommend any specific financial actions, and we are not responsible for any losses or damages that may arise from the use of the data or information presented.
By accessing and using the data presented in this analysis, you acknowledge and agree that you do so at your own risk. You should also review and comply with the terms of use and terms of service of the data sources from which the information is obtained.
Please consult with a qualified financial professional before making any investment or financial decisions. The information presented should not be construed as financial advice or recommendations.
Disclaimer: This material is provided for educational and entertainment purposes only. It does not constitute trading or investment advice.