See the structure
before the move.
Real ThinkorSwim studies — 3-minute Squeeze, Opening Range Breakout levels, custom volume oscillators — plus quantitative market-structure research. Demonstration only. No advice. Just the math.
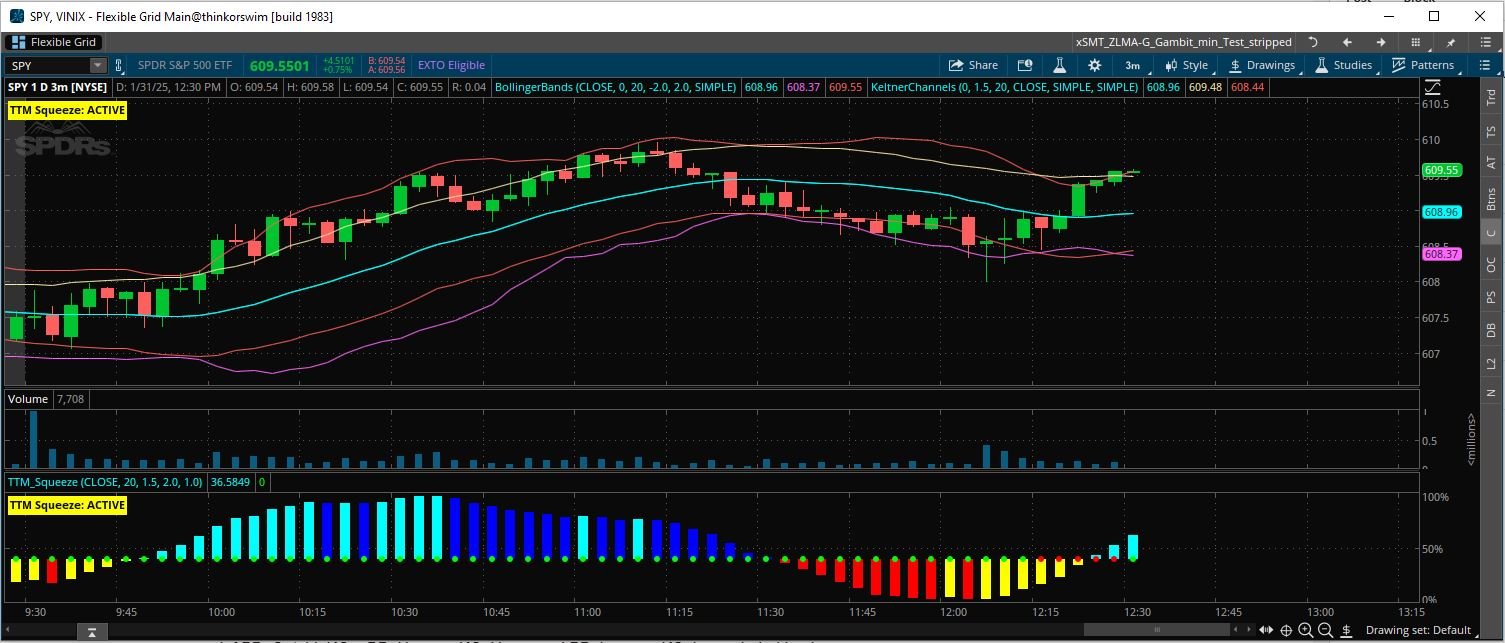
Models that live inside ThinkorSwim
Not screenshots of theory — actual studies running on the platform you already use.
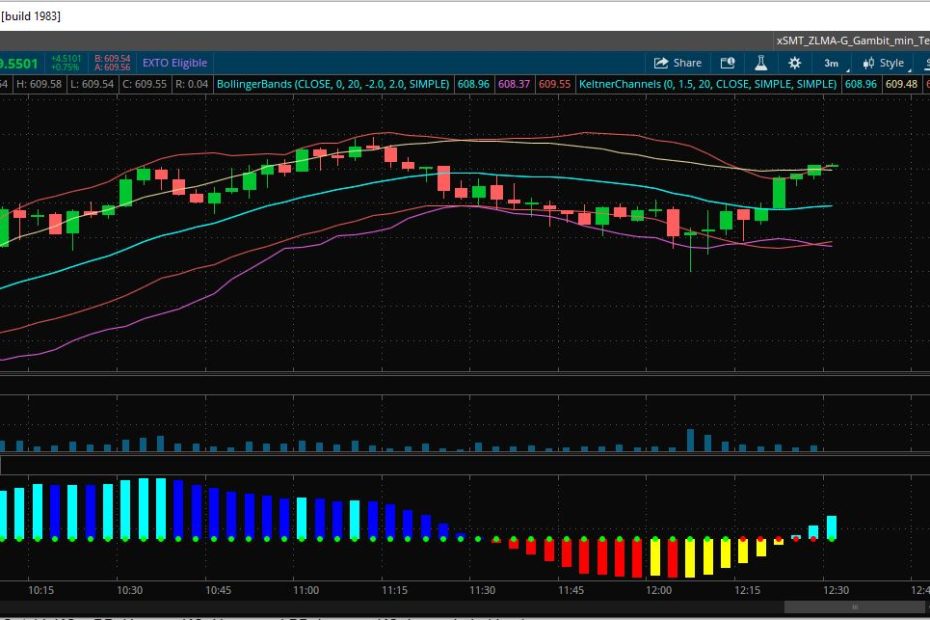
3-Minute Squeeze Model
Momentum + volatility compression on the 3-minute chart. Visual squeeze state, histogram direction, and clear active/inactive labels.
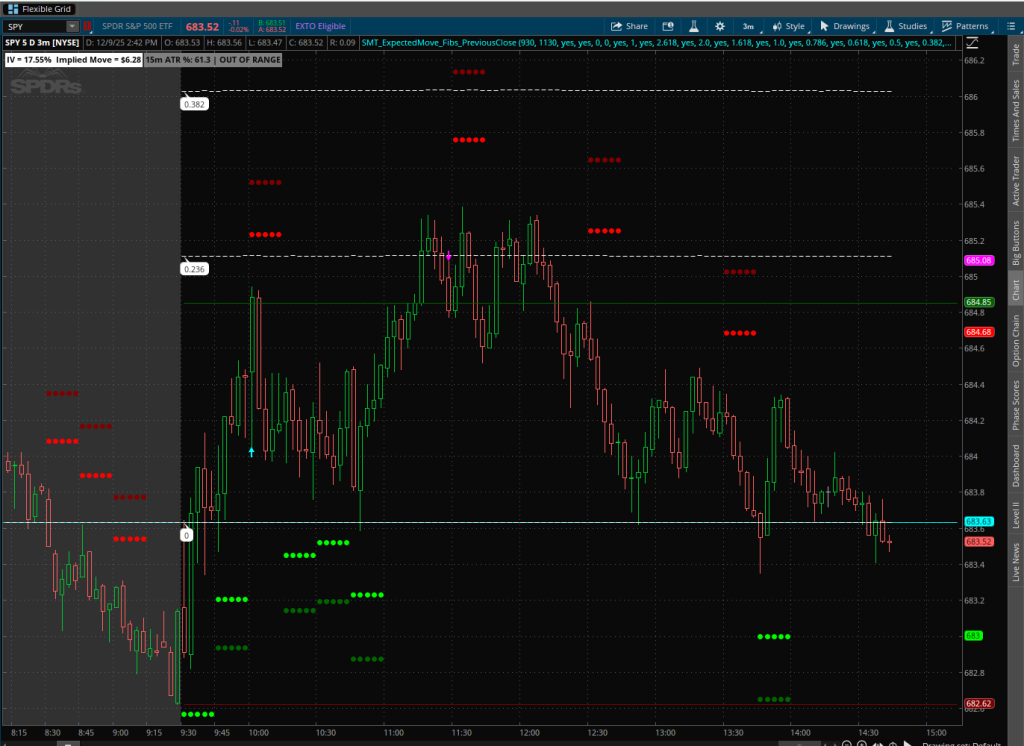
ORB + Expected Move Levels
Opening range breakout dots, Fibonacci expected-move levels, and prior-close reference — plotted live so you see structure as it forms.
Indicator toolkit
Volume, breadth, and custom oscillators documented for educational use
The 15-Minute ATR Normalized Range & Breakout Indicator
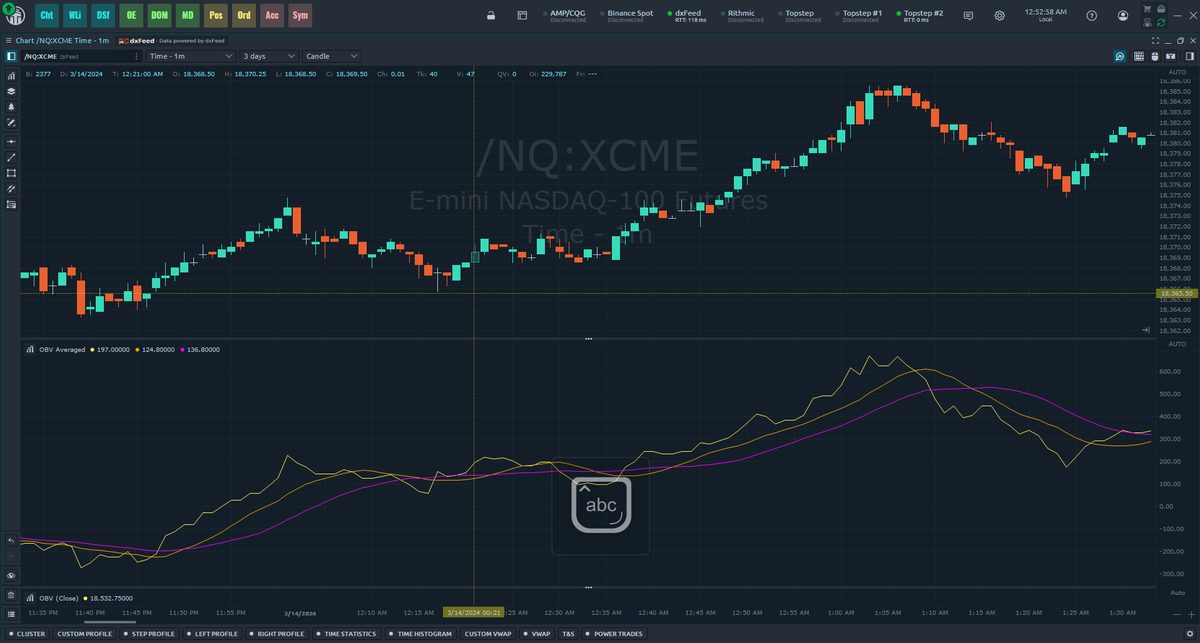
Unlock Market Insights: Power-Up Your OBV with Custom MA Calculations
Boost Your Trading with Improved On-Balance Volume Analysis
TOS Market Pulse Utility Labels
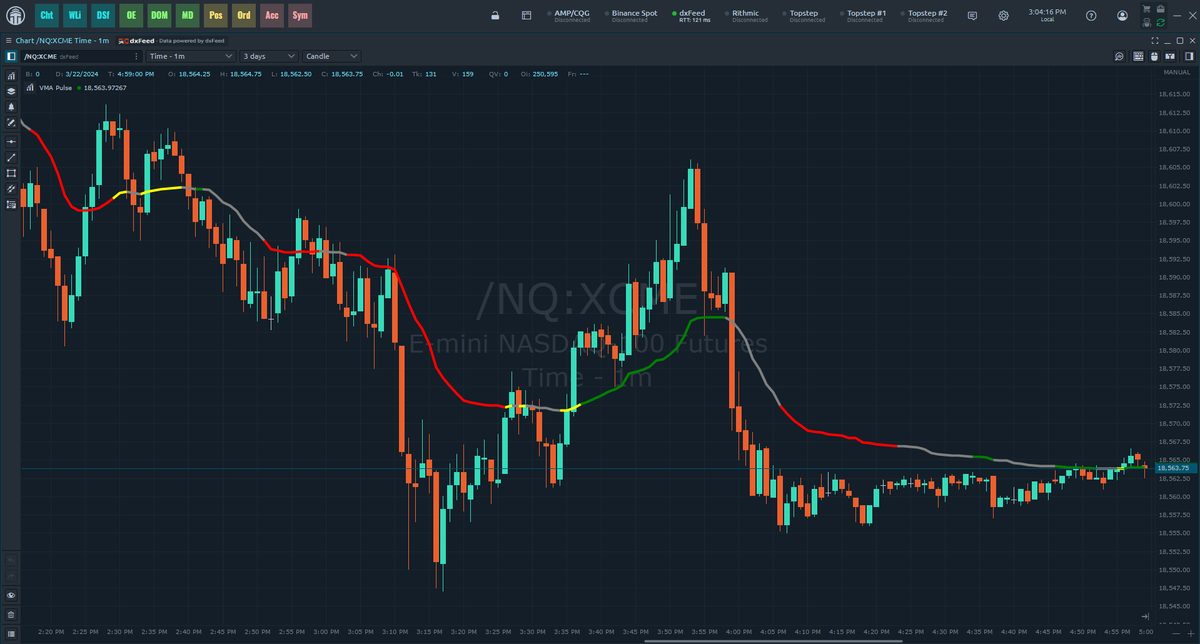
Latest research
Market structure, regime analysis, yield curves, Wyckoff
Income Statement Lies Exposed, What's Really Under the Bikini?
Full analysis and supporting material inside.
Higgledy Piggledy Growth: Why Past Performance Isn't a Guarantee of Future Success
Full analysis and supporting material inside.
Understanding ES vs. SPY: Differences and Correlation
Full analysis and supporting material inside.
Ready for the source files?
Public research stays free. The monthly Model Access Pass unlocks ThinkScript sources, weekly parameter updates, and exclusive scanners.
Cancel anytime · Educational demonstration only · Not investment advice