TOS Market Pulse Utility Labels
Market Pulse Utility Labels
The guys over at TOSIndicators.com are awesome when it comes to providing top-notch indicators. They've just provided an update to their "Market Pulse" indicator which gives a breakdown of sector activity using TOS labeling. The idea is to provide the trader with a glance at market conditions relative to what they are trading at the moment. This is an overall take on what stage the market is in, acceleration, distribution, accumulation, or deceleration. They do this by computing and comparing volume-weighted moving averages. Here in lies some uniqueness. While many traders use and compare moving averages, these are weighted based on the volume. Joseph Granville, who doesn't get the credit he deserves for the PVT and OBV (On-Balance Volume) indicators, was one of the earliest to introduce the idea of volume weighting and it has been a reliable market metric ever since.
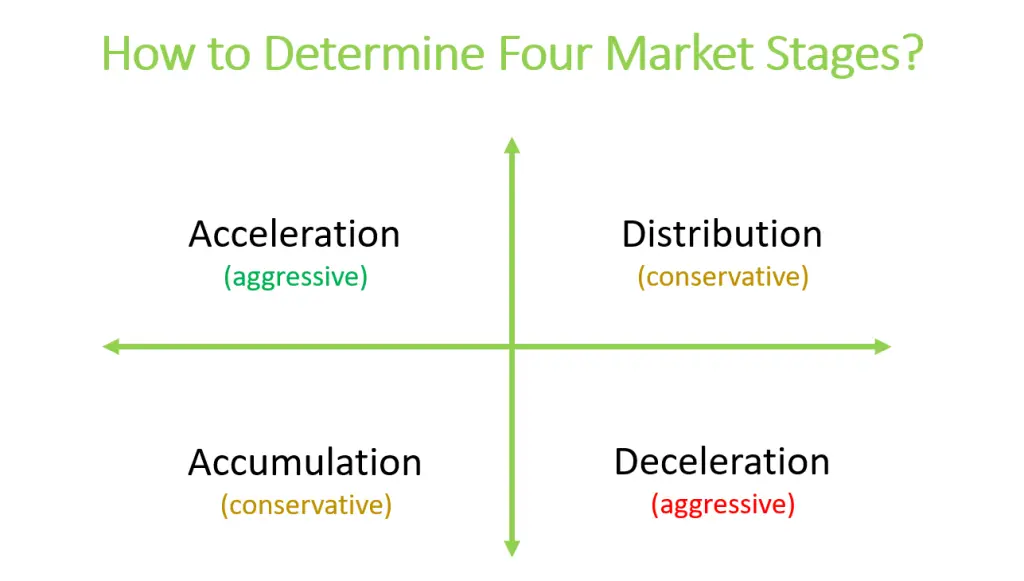
TOSIndicators.com specifically uses the volume-weighted 8, 21 and 34 moving averages and then compares their relative position to one another to determine the state for the sector of interest.
def SPYbullish = if SPYvwma8 > SPYvwma21 and SPYvwma21 > SPYvwma34 then 1 else 0;
def SPYbearish = if SPYvwma8 < SPYvwma21 and SPYvwma21 < SPYvwma34 then 1 else 0;
def SPYdistribution = if !SPYbullish and !SPYbearish then 1 else 0;
Here "bullish" would be analogous to "acceleration" and "bearish" to "deceleration". The results are then displayed as labels that can be placed on either an upper chart or a lower indicator. In doing this as labels it keeps your chart clean so you can more clearly observe price-action. Their Market Pulse indicator can be found on their website along with a video on it and their most recent updates.
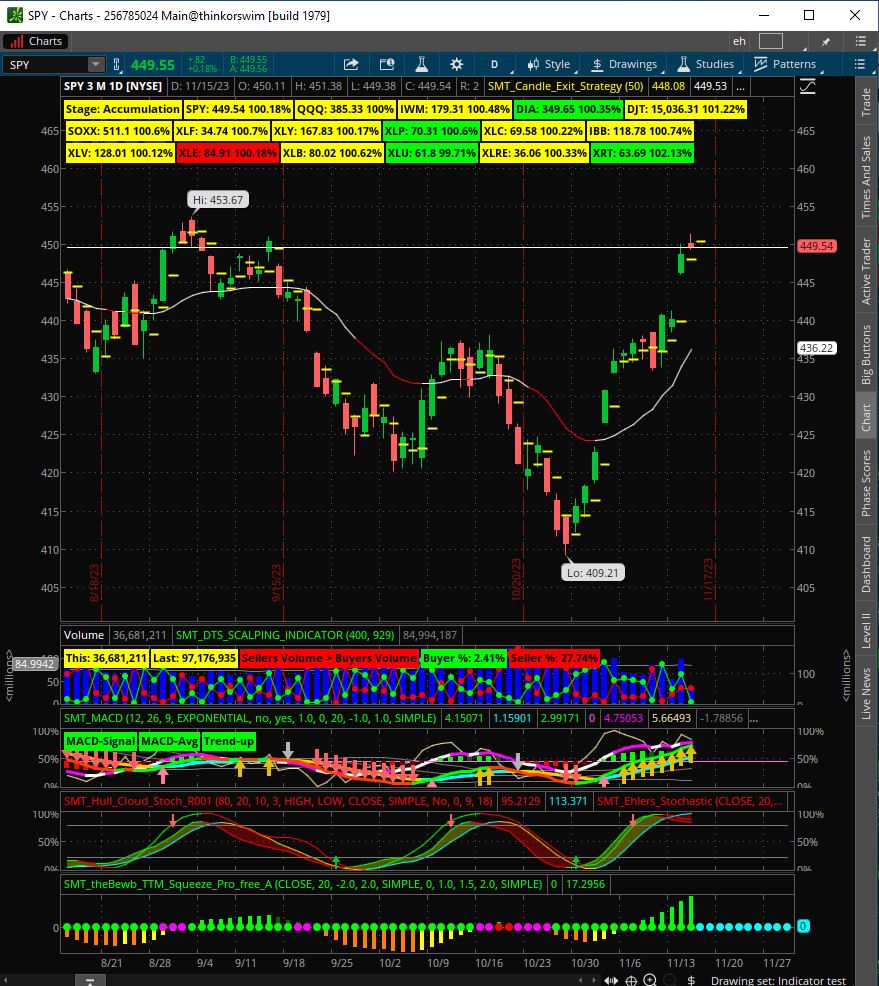
An individual on their YouTube channel requested a "percentage gain or loss number" for each of the sectors; I've added their request to the modified code below as well as rounded all numbers to two decimal places to keep things as compact as possible. I find this most useful on a daily timeframe when used along with market breadth indicators. Note, you can use this on lower timeframes, when you change timeframes the percentage shown is representative of that time frame. On timeframes less than one day black patches may periodically appear as the indicator information is updated depending upon the speed of your data connection and computer. This patchiness can be alleviated by running less code and fewer windows.
The original unedited code can be found on the TOSIndicators.com website, the modified code below can be downloaded via ThinkOrSwim here: (SMT_TOS_MP_Utility_Labels).
################################################################################################################################################################################
#Code origin: TOS Indicators (search for their youtube channel)
#Modded by StockPsyOp
#Website: https://TheValent.com
################################################################################################################################################################################

#TOS Indicators
#Home of the Volatility Box
#Indicator Name: Market Pulse Utility Labels
#Full Tutorial Available Here: www.tosindicators.com/indicators/market-pulse


###SPY###
def SPYprice = Round(close(symbol="SPY"),2);
def SPYVolume = volume(symbol="SPY");
def length = 21;

def SPYtmp1 = if SPYprice > SPYprice[1] then SPYprice - SPYprice[1] else 0;
def SPYtmp2 = if SPYprice[1] > SPYprice then SPYprice[1] - SPYprice else 0;
def SPYd2 = Sum(SPYtmp1, length);
def SPYd4 = Sum(SPYtmp2, length);
def SPYcond = SPYd2 + SPYd4 == 0;
def SPYad3 = if SPYcond then 0 else (SPYd2 - SPYd4) / (SPYd2 + SPYd4) * 100;
def SPYcoeff = 2 / (length + 1) * AbsValue(SPYad3) / 100;
def SPYasd = CompoundValue("visible data" = SPYcoeff * SPYprice + (if IsNaN(SPYasd[1]) then 0 else SPYasd[1]) * (1 - SPYcoeff), "historical data" = SPYprice
);
def SPYVMA = Round(SPYasd,2);

def SPYvwma8 = sum(SPYVolume * SPYprice, 8) / sum(SPYVolume, 8);
def SPYvwma21 = sum(SPYVolume * SPYprice, 21) / sum(SPYVolume, 21);
def SPYvwma34 = sum(SPYVolume * SPYprice, 34) / sum(SPYVolume, 34);

def SPY821bullish = if SPYvwma8 > SPYvwma21 and SPYvwma21 < SPYvwma34 then 1 else 0;
def SPY2134bullish = if SPYvwma8 < SPYvwma21 and SPYvwma21 > SPYvwma34 then 1 else 0;
def SPYbullish = if SPYvwma8 > SPYvwma21 and SPYvwma21 > SPYvwma34 then 1 else 0;
def SPYbearish = if SPYvwma8 < SPYvwma21 and SPYvwma21 < SPYvwma34 then 1 else 0;
def SPYdistribution = if !SPYbullish and !SPYbearish then 1 else 0;

AddLabel(yes, "SPY: "+SPYPrice + " " + Round((SPYPrice/SPYPrice[1]) * 100) + "%", if SPYBullish then color.green else if SPYBearish then color.red else if SPYDistribution then color.yellow else color.gray);

###QQQ
def QQQprice = Round(close(symbol="QQQ"),2);
def QQQVolume = volume(symbol="QQQ");

def QQQtmp1 = if QQQprice > QQQprice[1] then QQQprice - QQQprice[1] else 0;
def QQQtmp2 = if QQQprice[1] > QQQprice then QQQprice[1] - QQQprice else 0;
def QQQd2 = Sum(QQQtmp1, length);
def QQQd4 = Sum(QQQtmp2, length);
def QQQcond = QQQd2 + QQQd4 == 0;
def QQQad3 = if QQQcond then 0 else (QQQd2 - QQQd4) / (QQQd2 + QQQd4) * 100;
def QQQcoeff = 2 / (length + 1) * AbsValue(QQQad3) / 100;
def QQQasd = CompoundValue("visible data" = QQQcoeff * QQQprice + (if IsNaN(QQQasd[1]) then 0 else QQQasd[1]) * (1 - QQQcoeff), "historical data" = QQQprice
);
def QQQVMA = Round(QQQasd,2);

def QQQvwma8 = sum(QQQVolume * QQQprice, 8) / sum(QQQVolume, 8);
def QQQvwma21 = sum(QQQVolume * QQQprice, 21) / sum(QQQVolume, 21);
def QQQvwma34 = sum(QQQVolume * QQQprice, 34) / sum(QQQVolume, 34);

def QQQbullish = if QQQvwma8 > QQQvwma21 and QQQvwma21 > QQQvwma34 then 1 else 0;
def QQQbearish = if QQQvwma8 < QQQvwma21 and QQQvwma21 < QQQvwma34 then 1 else 0;
def QQQdistribution = if !QQQbullish and !QQQbearish then 1 else 0;

AddLabel(yes, "QQQ: "+QQQPrice + " " + Round((QQQPrice/QQQPrice[1]) * 100) + "%", if QQQBullish then color.green else if QQQBearish then color.red else if QQQDistribution then color.yellow else color.gray);


###IWM
def IWMprice = Round(close(symbol="IWM"),2);
def IWMVolume = volume(symbol="IWM");

def IWMtmp1 = if IWMprice > IWMprice[1] then IWMprice - IWMprice[1] else 0;
def IWMtmp2 = if IWMprice[1] > IWMprice then IWMprice[1] - IWMprice else 0;
def IWMd2 = Sum(IWMtmp1, length);
def IWMd4 = Sum(IWMtmp2, length);
def IWMcond = IWMd2 + IWMd4 == 0;
def IWMad3 = if IWMcond then 0 else (IWMd2 - IWMd4) / (IWMd2 + IWMd4) * 100;
def IWMcoeff = 2 / (length + 1) * AbsValue(IWMad3) / 100;
def IWMasd = CompoundValue("visible data" = IWMcoeff * IWMprice + (if IsNaN(IWMasd[1]) then 0 else IWMasd[1]) * (1 - IWMcoeff), "historical data" = IWMprice
);
def IWMVMA = Round(IWMasd,2);

def IWMvwma8 = sum(IWMVolume * IWMprice, 8) / sum(IWMVolume, 8);
def IWMvwma21 = sum(IWMVolume * IWMprice, 21) / sum(IWMVolume, 21);
def IWMvwma34 = sum(IWMVolume * IWMprice, 34) / sum(IWMVolume, 34);

def IWMbullish = if IWMvwma8 > IWMvwma21 and IWMvwma21 > IWMvwma34 then 1 else 0;
def IWMbearish = if IWMvwma8 < IWMvwma21 and IWMvwma21 < IWMvwma34 then 1 else 0;
def IWMdistribution = if !IWMbullish and !IWMbearish then 1 else 0;

AddLabel(yes, "IWM: "+IWMPrice + " " + Round((IWMPrice/IWMPrice[1]) * 100) + "%", if IWMBullish then color.green else if IWMBearish then color.red else if IWMDistribution then color.yellow else color.gray);

###DIA

def DIAprice = Round(close(symbol="DIA"),2);
def DIAVolume = volume(symbol="DIA");

def DIAtmp1 = if DIAprice > DIAprice[1] then DIAprice - DIAprice[1] else 0;
def DIAtmp2 = if DIAprice[1] > DIAprice then DIAprice[1] - DIAprice else 0;
def DIAd2 = Sum(DIAtmp1, length);
def DIAd4 = Sum(DIAtmp2, length);
def DIAcond = DIAd2 + DIAd4 == 0;
def DIAad3 = if DIAcond then 0 else (DIAd2 - DIAd4) / (DIAd2 + DIAd4) * 100;
def DIAcoeff = 2 / (length + 1) * AbsValue(DIAad3) / 100;
def DIAasd = CompoundValue("visible data" = DIAcoeff * DIAprice + (if IsNaN(DIAasd[1]) then 0 else DIAasd[1]) * (1 - DIAcoeff), "historical data" = DIAprice
);
def DIAVMA = Round(DIAasd,2);

def DIAvwma8 = sum(DIAVolume * DIAprice, 8) / sum(DIAVolume, 8);
def DIAvwma21 = sum(DIAVolume * DIAprice, 21) / sum(DIAVolume, 21);
def DIAvwma34 = sum(DIAVolume * DIAprice, 34) / sum(DIAVolume, 34);

def DIAbullish = if DIAvwma8 > DIAvwma21 and DIAvwma21 > DIAvwma34 then 1 else 0;
def DIAbearish = if DIAvwma8 < DIAvwma21 and DIAvwma21 < DIAvwma34 then 1 else 0;
def DIAdistribution = if !DIAbullish and !DIAbearish then 1 else 0;

AddLabel(yes, "DIA: "+DIAPrice + " " + Round((DIAPrice/DIAPrice[1]) * 100) + "%", if DIABullish then color.green else if DIABearish then color.red else if DIADistribution then color.yellow else color.gray);


###$DJT
def DJTprice = Round(close(symbol="$DJT"),2);
def DJTVolume = volume(symbol="$DJT");

def DJTtmp1 = if DJTprice > DJTprice[1] then DJTprice - DJTprice[1] else 0;
def DJTtmp2 = if DJTprice[1] > DJTprice then DJTprice[1] - DJTprice else 0;
def DJTd2 = Sum(DJTtmp1, length);
def DJTd4 = Sum(DJTtmp2, length);
def DJTcond = DJTd2 + DJTd4 == 0;
def DJTad3 = if DJTcond then 0 else (DJTd2 - DJTd4) / (DJTd2 + DJTd4) * 100;
def DJTcoeff = 2 / (length + 1) * AbsValue(DJTad3) / 100;
def DJTasd = CompoundValue("visible data" = DJTcoeff * DJTprice + (if IsNaN(DJTasd[1]) then 0 else DJTasd[1]) * (1 - DJTcoeff), "historical data" = DJTprice
);
def DJTVMA = Round(DJTasd,2);

def DJTvwma8 = sum(DJTVolume * DJTprice, 8) / sum(DJTVolume, 8);
def DJTvwma21 = sum(DJTVolume * DJTprice, 21) / sum(DJTVolume, 21);
def DJTvwma34 = sum(DJTVolume * DJTprice, 34) / sum(DJTVolume, 34);

def DJTbullish = if DJTvwma8 > DJTvwma21 and DJTvwma21 > DJTvwma34 then 1 else 0;
def DJTbearish = if DJTvwma8 < DJTvwma21 and DJTvwma21 < DJTvwma34 then 1 else 0;
def DJTdistribution = if !DJTbullish and !DJTbearish then 1 else 0;

AddLabel(yes, "DJT: "+DJTPrice + " " + Round((DJTPrice/DJTPrice[1]) * 100) + "%", if DJTBullish then color.green else if DJTBearish then color.red else if DJTDistribution then color.yellow else color.gray);


###SOXX
def SOXXprice = Round(close(symbol="SOXX"),2);
def SOXXVolume = volume(symbol="SOXX");

def SOXXtmp1 = if SOXXprice > SOXXprice[1] then SOXXprice - SOXXprice[1] else 0;
def SOXXtmp2 = if SOXXprice[1] > SOXXprice then SOXXprice[1] - SOXXprice else 0;
def SOXXd2 = Sum(SOXXtmp1, length);
def SOXXd4 = Sum(SOXXtmp2, length);
def SOXXcond = SOXXd2 + SOXXd4 == 0;
def SOXXad3 = if SOXXcond then 0 else (SOXXd2 - SOXXd4) / (SOXXd2 + SOXXd4) * 100;
def SOXXcoeff = 2 / (length + 1) * AbsValue(SOXXad3) / 100;
def SOXXasd = CompoundValue("visible data" = SOXXcoeff * SOXXprice + (if IsNaN(SOXXasd[1]) then 0 else SOXXasd[1]) * (1 - SOXXcoeff), "historical data" = SOXXprice
);
def SOXXVMA = Round(SOXXasd,2);

def SOXXvwma8 = sum(SOXXVolume * SOXXprice, 8) / sum(SOXXVolume, 8);
def SOXXvwma21 = sum(SOXXVolume * SOXXprice, 21) / sum(SOXXVolume, 21);
def SOXXvwma34 = sum(SOXXVolume * SOXXprice, 34) / sum(SOXXVolume, 34);

def SOXXbullish = if SOXXvwma8 > SOXXvwma21 and SOXXvwma21 > SOXXvwma34 then 1 else 0;
def SOXXbearish = if SOXXvwma8 < SOXXvwma21 and SOXXvwma21 < SOXXvwma34 then 1 else 0;
def SOXXdistribution = if !SOXXbullish and !SOXXbearish then 1 else 0;

AddLabel(yes, "SOXX: "+SOXXPrice + " " + Round((SOXXPrice/SOXXPrice[1]) * 100) + "%", if SOXXBullish then color.green else if SOXXBearish then color.red else if SOXXDistribution then color.yellow else color.gray);


##XLF
def XLFprice = Round(close(symbol="XLF"),2);
def XLFVolume = volume(symbol="XLF");

def XLFtmp1 = if XLFprice > XLFprice[1] then XLFprice - XLFprice[1] else 0;
def XLFtmp2 = if XLFprice[1] > XLFprice then XLFprice[1] - XLFprice else 0;
def XLFd2 = Sum(XLFtmp1, length);
def XLFd4 = Sum(XLFtmp2, length);
def XLFcond = XLFd2 + XLFd4 == 0;
def XLFad3 = if XLFcond then 0 else (XLFd2 - XLFd4) / (XLFd2 + XLFd4) * 100;
def XLFcoeff = 2 / (length + 1) * AbsValue(XLFad3) / 100;
def XLFasd = CompoundValue("visible data" = XLFcoeff * XLFprice + (if IsNaN(XLFasd[1]) then 0 else XLFasd[1]) * (1 - XLFcoeff), "historical data" = XLFprice
);
def XLFVMA = Round(XLFasd,2);

def XLFvwma8 = sum(XLFVolume * XLFprice, 8) / sum(XLFVolume, 8);
def XLFvwma21 = sum(XLFVolume * XLFprice, 21) / sum(XLFVolume, 21);
def XLFvwma34 = sum(XLFVolume * XLFprice, 34) / sum(XLFVolume, 34);

def XLFbullish = if XLFvwma8 > XLFvwma21 and XLFvwma21 > XLFvwma34 then 1 else 0;
def XLFbearish = if XLFvwma8 < XLFvwma21 and XLFvwma21 < XLFvwma34 then 1 else 0;
def XLFdistribution = if !XLFbullish and !XLFbearish then 1 else 0;

AddLabel(yes, "XLF: "+XLFPrice + " " + Round((XLFPrice/XLFPrice[1]) * 100) + "%", if XLFBullish then color.green else if XLFBearish then color.red else if XLFDistribution then color.yellow else color.gray);

###XLY

def XLYprice = Round(close(symbol="XLY"),2);
def XLYVolume = volume(symbol="XLY");

def XLYtmp1 = if XLYprice > XLYprice[1] then XLYprice - XLYprice[1] else 0;
def XLYtmp2 = if XLYprice[1] > XLYprice then XLYprice[1] - XLYprice else 0;
def XLYd2 = Sum(XLYtmp1, length);
def XLYd4 = Sum(XLYtmp2, length);
def XLYcond = XLYd2 + XLYd4 == 0;
def XLYad3 = if XLYcond then 0 else (XLYd2 - XLYd4) / (XLYd2 + XLYd4) * 100;
def XLYcoeff = 2 / (length + 1) * AbsValue(XLYad3) / 100;
def XLYasd = CompoundValue("visible data" = XLYcoeff * XLYprice + (if IsNaN(XLYasd[1]) then 0 else XLYasd[1]) * (1 - XLYcoeff), "historical data" = XLYprice
);
def XLYVMA = Round(XLYasd,2);

def XLYvwma8 = sum(XLYVolume * XLYprice, 8) / sum(XLYVolume, 8);
def XLYvwma21 = sum(XLYVolume * XLYprice, 21) / sum(XLYVolume, 21);
def XLYvwma34 = sum(XLYVolume * XLYprice, 34) / sum(XLYVolume, 34);

def XLYbullish = if XLYvwma8 > XLYvwma21 and XLYvwma21 > XLYvwma34 then 1 else 0;
def XLYbearish = if XLYvwma8 < XLYvwma21 and XLYvwma21 < XLYvwma34 then 1 else 0;
def XLYdistribution = if !XLYbullish and !XLYbearish then 1 else 0;

AddLabel(yes, "XLY: "+XLYPrice + " " + Round((XLYPrice/XLYPrice[1]) * 100) + "%", if XLYBullish then color.green else if XLYBearish then color.red else if XLYDistribution then color.yellow else color.gray);

###XLP
def XLPprice = Round(close(symbol="XLP"),2);
def XLPVolume = volume(symbol="XLP");

def XLPtmp1 = if XLPprice > XLPprice[1] then XLPprice - XLPprice[1] else 0;
def XLPtmp2 = if XLPprice[1] > XLPprice then XLPprice[1] - XLPprice else 0;
def XLPd2 = Sum(XLPtmp1, length);
def XLPd4 = Sum(XLPtmp2, length);
def XLPcond = XLPd2 + XLPd4 == 0;
def XLPad3 = if XLPcond then 0 else (XLPd2 - XLPd4) / (XLPd2 + XLPd4) * 100;
def XLPcoeff = 2 / (length + 1) * AbsValue(XLPad3) / 100;
def XLPasd = CompoundValue("visible data" = XLPcoeff * XLPprice + (if IsNaN(XLPasd[1]) then 0 else XLPasd[1]) * (1 - XLPcoeff), "historical data" = XLPprice
);
def XLPVMA = Round(XLPasd,2);

def XLPvwma8 = sum(XLPVolume * XLPprice, 8) / sum(XLPVolume, 8);
def XLPvwma21 = sum(XLPVolume * XLPprice, 21) / sum(XLPVolume, 21);
def XLPvwma34 = sum(XLPVolume * XLPprice, 34) / sum(XLPVolume, 34);

def XLPbullish = if XLPvwma8 > XLPvwma21 and XLPvwma21 > XLPvwma34 then 1 else 0;
def XLPbearish = if XLPvwma8 < XLPvwma21 and XLPvwma21 < XLPvwma34 then 1 else 0;
def XLPdistribution = if !XLPbullish and !XLPbearish then 1 else 0;

AddLabel(yes, "XLP: "+XLPPrice + " " + Round((XLPPrice/XLPPrice[1]) * 100) + "%", if XLPBullish then color.green else if XLPBearish then color.red else if XLPDistribution then color.yellow else color.gray);


###XLC
def XLCprice = Round(close(symbol="XLC"),2);
def XLCVolume = volume(symbol="XLC");

def XLCtmp1 = if XLCprice > XLCprice[1] then XLCprice - XLCprice[1] else 0;
def XLCtmp2 = if XLCprice[1] > XLCprice then XLCprice[1] - XLCprice else 0;
def XLCd2 = Sum(XLCtmp1, length);
def XLCd4 = Sum(XLCtmp2, length);
def XLCcond = XLCd2 + XLCd4 == 0;
def XLCad3 = if XLCcond then 0 else (XLCd2 - XLCd4) / (XLCd2 + XLCd4) * 100;
def XLCcoeff = 2 / (length + 1) * AbsValue(XLCad3) / 100;
def XLCasd = CompoundValue("visible data" = XLCcoeff * XLCprice + (if IsNaN(XLCasd[1]) then 0 else XLCasd[1]) * (1 - XLCcoeff), "historical data" = XLCprice
);
def XLCVMA = Round(XLCasd,2);

def XLCvwma8 = sum(XLCVolume * XLCprice, 8) / sum(XLCVolume, 8);
def XLCvwma21 = sum(XLCVolume * XLCprice, 21) / sum(XLCVolume, 21);
def XLCvwma34 = sum(XLCVolume * XLCprice, 34) / sum(XLCVolume, 34);

def XLCbullish = if XLCvwma8 > XLCvwma21 and XLCvwma21 > XLCvwma34 then 1 else 0;
def XLCbearish = if XLCvwma8 < XLCvwma21 and XLCvwma21 < XLCvwma34 then 1 else 0;
def XLCdistribution = if !XLCbullish and !XLCbearish then 1 else 0;

AddLabel(yes, "XLC: "+XLCPrice + " " + Round((XLCPrice/XLCPrice[1]) * 100) + "%", if XLCBullish then color.green else if XLCBearish then color.red else if XLCDistribution then color.yellow else color.gray);


###IBB
def IBBprice = Round(close(symbol="IBB"),2);
def IBBVolume = volume(symbol="IBB");

def IBBtmp1 = if IBBprice > IBBprice[1] then IBBprice - IBBprice[1] else 0;
def IBBtmp2 = if IBBprice[1] > IBBprice then IBBprice[1] - IBBprice else 0;
def IBBd2 = Sum(IBBtmp1, length);
def IBBd4 = Sum(IBBtmp2, length);
def IBBcond = IBBd2 + IBBd4 == 0;
def IBBad3 = if IBBcond then 0 else (IBBd2 - IBBd4) / (IBBd2 + IBBd4) * 100;
def IBBcoeff = 2 / (length + 1) * AbsValue(IBBad3) / 100;
def IBBasd = CompoundValue("visible data" = IBBcoeff * IBBprice + (if IsNaN(IBBasd[1]) then 0 else IBBasd[1]) * (1 - IBBcoeff), "historical data" = IBBprice
);
def IBBVMA = Round(IBBasd,2);

def IBBvwma8 = sum(IBBVolume * IBBprice, 8) / sum(IBBVolume, 8);
def IBBvwma21 = sum(IBBVolume * IBBprice, 21) / sum(IBBVolume, 21);
def IBBvwma34 = sum(IBBVolume * IBBprice, 34) / sum(IBBVolume, 34);

def IBBbullish = if IBBvwma8 > IBBvwma21 and IBBvwma21 > IBBvwma34 then 1 else 0;
def IBBbearish = if IBBvwma8 < IBBvwma21 and IBBvwma21 < IBBvwma34 then 1 else 0;
def IBBdistribution = if !IBBbullish and !IBBbearish then 1 else 0;

AddLabel(yes, "IBB: "+IBBPrice + " " + Round((IBBPrice/IBBPrice[1]) * 100) + "%", if IBBBullish then color.green else if IBBBearish then color.red else if IBBDistribution then color.yellow else color.gray);


###XLV
def XLVprice = Round(close(symbol="XLV"),2);
def XLVVolume = volume(symbol="XLV");

def XLVtmp1 = if XLVprice > XLVprice[1] then XLVprice - XLVprice[1] else 0;
def XLVtmp2 = if XLVprice[1] > XLVprice then XLVprice[1] - XLVprice else 0;
def XLVd2 = Sum(XLVtmp1, length);
def XLVd4 = Sum(XLVtmp2, length);
def XLVcond = XLVd2 + XLVd4 == 0;
def XLVad3 = if XLVcond then 0 else (XLVd2 - XLVd4) / (XLVd2 + XLVd4) * 100;
def XLVcoeff = 2 / (length + 1) * AbsValue(XLVad3) / 100;
def XLVasd = CompoundValue("visible data" = XLVcoeff * XLVprice + (if IsNaN(XLVasd[1]) then 0 else XLVasd[1]) * (1 - XLVcoeff), "historical data" = XLVprice
);
def XLVVMA = Round(XLVasd,2);

def XLVvwma8 = sum(XLVVolume * XLVprice, 8) / sum(XLVVolume, 8);
def XLVvwma21 = sum(XLVVolume * XLVprice, 21) / sum(XLVVolume, 21);
def XLVvwma34 = sum(XLVVolume * XLVprice, 34) / sum(XLVVolume, 34);

def XLVbullish = if XLVvwma8 > XLVvwma21 and XLVvwma21 > XLVvwma34 then 1 else 0;
def XLVbearish = if XLVvwma8 < XLVvwma21 and XLVvwma21 < XLVvwma34 then 1 else 0;
def XLVdistribution = if !XLVbullish and !XLVbearish then 1 else 0;

AddLabel(yes, "XLV: "+XLVPrice + " " + Round((XLVPrice/XLVPrice[1]) * 100) + "%", if XLVBullish then color.green else if XLVBearish then color.red else if XLVDistribution then color.yellow else color.gray);


###XLE
def XLEprice = Round(close(symbol="XLE"),2);
def XLEVolume = volume(symbol="XLE");

def XLEtmp1 = if XLEprice > XLEprice[1] then XLEprice - XLEprice[1] else 0;
def XLEtmp2 = if XLEprice[1] > XLEprice then XLEprice[1] - XLEprice else 0;
def XLEd2 = Sum(XLEtmp1, length);
def XLEd4 = Sum(XLEtmp2, length);
def XLEcond = XLEd2 + XLEd4 == 0;
def XLEad3 = if XLEcond then 0 else (XLEd2 - XLEd4) / (XLEd2 + XLEd4) * 100;
def XLEcoeff = 2 / (length + 1) * AbsValue(XLEad3) / 100;
def XLEasd = CompoundValue("visible data" = XLEcoeff * XLEprice + (if IsNaN(XLEasd[1]) then 0 else XLEasd[1]) * (1 - XLEcoeff), "historical data" = XLEprice
);
def XLEVMA = Round(XLEasd,2);

def XLEvwma8 = sum(XLEVolume * XLEprice, 8) / sum(XLEVolume, 8);
def XLEvwma21 = sum(XLEVolume * XLEprice, 21) / sum(XLEVolume, 21);
def XLEvwma34 = sum(XLEVolume * XLEprice, 34) / sum(XLEVolume, 34);

def XLEbullish = if XLEvwma8 > XLEvwma21 and XLEvwma21 > XLEvwma34 then 1 else 0;
def XLEbearish = if XLEvwma8 < XLEvwma21 and XLEvwma21 < XLEvwma34 then 1 else 0;
def XLEdistribution = if !XLEbullish and !XLEbearish then 1 else 0;

AddLabel(yes, "XLE: "+XLEPrice + " " + Round((XLEPrice/XLEPrice[1]) * 100) + "%", if XLEBullish then color.green else if XLEBearish then color.red else if XLEDistribution then color.yellow else color.gray);

###XLB
def XLBprice = Round(close(symbol="XLB"),2);
def XLBVolume = volume(symbol="XLB");

def XLBtmp1 = if XLBprice > XLBprice[1] then XLBprice - XLBprice[1] else 0;
def XLBtmp2 = if XLBprice[1] > XLBprice then XLBprice[1] - XLBprice else 0;
def XLBd2 = Sum(XLBtmp1, length);
def XLBd4 = Sum(XLBtmp2, length);
def XLBcond = XLBd2 + XLBd4 == 0;
def XLBad3 = if XLBcond then 0 else (XLBd2 - XLBd4) / (XLBd2 + XLBd4) * 100;
def XLBcoeff = 2 / (length + 1) * AbsValue(XLBad3) / 100;
def XLBasd = CompoundValue("visible data" = XLBcoeff * XLBprice + (if IsNaN(XLBasd[1]) then 0 else XLBasd[1]) * (1 - XLBcoeff), "historical data" = XLBprice
);
def XLBVMA = Round(XLBasd,2);

def XLBvwma8 = sum(XLBVolume * XLBprice, 8) / sum(XLBVolume, 8);
def XLBvwma21 = sum(XLBVolume * XLBprice, 21) / sum(XLBVolume, 21);
def XLBvwma34 = sum(XLBVolume * XLBprice, 34) / sum(XLBVolume, 34);

def XLBbullish = if XLBvwma8 > XLBvwma21 and XLBvwma21 > XLBvwma34 then 1 else 0;
def XLBbearish = if XLBvwma8 < XLBvwma21 and XLBvwma21 < XLBvwma34 then 1 else 0;
def XLBdistribution = if !XLBbullish and !XLBbearish then 1 else 0;

AddLabel(yes, "XLB: "+ XLBPrice + " " + Round((XLBPrice/XLBPrice[1]) * 100) + "%", if XLBBullish then color.green else if XLBBearish then color.red else if XLBDistribution then color.yellow else color.gray);


###XLU
def XLUprice = Round(close(symbol="XLU"),2);
def XLUVolume = volume(symbol="XLU");

def XLUtmp1 = if XLUprice > XLUprice[1] then XLUprice - XLUprice[1] else 0;
def XLUtmp2 = if XLUprice[1] > XLUprice then XLUprice[1] - XLUprice else 0;
def XLUd2 = Sum(XLUtmp1, length);
def XLUd4 = Sum(XLUtmp2, length);
def XLUcond = XLUd2 + XLUd4 == 0;
def XLUad3 = if XLUcond then 0 else (XLUd2 - XLUd4) / (XLUd2 + XLUd4) * 100;
def XLUcoeff = 2 / (length + 1) * AbsValue(XLUad3) / 100;
def XLUasd = CompoundValue("visible data" = XLUcoeff * XLUprice + (if IsNaN(XLUasd[1]) then 0 else XLUasd[1]) * (1 - XLUcoeff), "historical data" = XLUprice
);
def XLUVMA = Round(XLUasd,2);

def XLUvwma8 = sum(XLUVolume * XLUprice, 8) / sum(XLUVolume, 8);
def XLUvwma21 = sum(XLUVolume * XLUprice, 21) / sum(XLUVolume, 21);
def XLUvwma34 = sum(XLUVolume * XLUprice, 34) / sum(XLUVolume, 34);

def XLUbullish = if XLUvwma8 > XLUvwma21 and XLUvwma21 > XLUvwma34 then 1 else 0;
def XLUbearish = if XLUvwma8 < XLUvwma21 and XLUvwma21 < XLUvwma34 then 1 else 0;
def XLUdistribution = if !XLUbullish and !XLUbearish then 1 else 0;

AddLabel(yes, "XLU: "+XLUPrice + " " + Round((XLUPrice/XLUPrice[1]) * 100) + "%", if XLUBullish then color.green else if XLUBearish then color.red else if XLUDistribution then color.yellow else color.gray);


###XLRE
def XLREprice = Round(close(symbol="XLRE"),2);
def XLREVolume = volume(symbol="XLRE");

def XLREtmp1 = if XLREprice > XLREprice[1] then XLREprice - XLREprice[1] else 0;
def XLREtmp2 = if XLREprice[1] > XLREprice then XLREprice[1] - XLREprice else 0;
def XLREd2 = Sum(XLREtmp1, length);
def XLREd4 = Sum(XLREtmp2, length);
def XLREcond = XLREd2 + XLREd4 == 0;
def XLREad3 = if XLREcond then 0 else (XLREd2 - XLREd4) / (XLREd2 + XLREd4) * 100;
def XLREcoeff = 2 / (length + 1) * AbsValue(XLREad3) / 100;
def XLREasd = CompoundValue("visible data" = XLREcoeff * XLREprice + (if IsNaN(XLREasd[1]) then 0 else XLREasd[1]) * (1 - XLREcoeff), "historical data" = XLREprice
);
def XLREVMA = Round(XLREasd,2);

def XLREvwma8 = sum(XLREVolume * XLREprice, 8) / sum(XLREVolume, 8);
def XLREvwma21 = sum(XLREVolume * XLREprice, 21) / sum(XLREVolume, 21);
def XLREvwma34 = sum(XLREVolume * XLREprice, 34) / sum(XLREVolume, 34);

def XLREbullish = if XLREvwma8 > XLREvwma21 and XLREvwma21 > XLREvwma34 then 1 else 0;
def XLREbearish = if XLREvwma8 < XLREvwma21 and XLREvwma21 < XLREvwma34 then 1 else 0;
def XLREdistribution = if !XLREbullish and !XLREbearish then 1 else 0;

AddLabel(yes, "XLRE: "+XLREPrice + " " + Round((XLREPrice/XLREPrice[1]) * 100) + "%", if XLREBullish then color.green else if XLREBearish then color.red else if XLREDistribution then color.yellow else color.gray);


###XRT
def XRTprice = Round(close(symbol="XRT"),2);
def XRTVolume = volume(symbol="XRT");

def XRTtmp1 = if XRTprice > XRTprice[1] then XRTprice - XRTprice[1] else 0;
def XRTtmp2 = if XRTprice[1] > XRTprice then XRTprice[1] - XRTprice else 0;
def XRTd2 = Sum(XRTtmp1, length);
def XRTd4 = Sum(XRTtmp2, length);
def XRTcond = XRTd2 + XRTd4 == 0;
def XRTad3 = if XRTcond then 0 else (XRTd2 - XRTd4) / (XRTd2 + XRTd4) * 100;
def XRTcoeff = 2 / (length + 1) * AbsValue(XRTad3) / 100;
def XRTasd = CompoundValue("visible data" = XRTcoeff * XRTprice + (if IsNaN(XRTasd[1]) then 0 else XRTasd[1]) * (1 - XRTcoeff), "historical data" = XRTprice
);
def XRTVMA = Round(XRTasd,2);

def XRTvwma8 = sum(XRTVolume * XRTprice, 8) / sum(XRTVolume, 8);
def XRTvwma21 = sum(XRTVolume * XRTprice, 21) / sum(XRTVolume, 21);
def XRTvwma34 = sum(XRTVolume * XRTprice, 34) / sum(XRTVolume, 34);

def XRTbullish = if XRTvwma8 > XRTvwma21 and XRTvwma21 > XRTvwma34 then 1 else 0;
def XRTbearish = if XRTvwma8 < XRTvwma21 and XRTvwma21 < XRTvwma34 then 1 else 0;
def XRTdistribution = if !XRTbullish and !XRTbearish then 1 else 0;

AddLabel(yes, "XRT: "+XRTPrice + " " + Round((XRTPrice/XRTPrice[1]) * 100) + "%", if XRTBullish then color.green else if XRTBearish then color.red else if XRTDistribution then color.yellow else color.gray);
Featured Image: bing.com Image Creator
Disclaimer: This material is provided for educational and entertainment purposes only. It does not constitute trading or investment advice. Hypothetical performance has inherent limitations.