Unlocking Profits: Conquering Fear and Greed with Stochastic Mastery
Cracking the Code: Deciphering What Stochastics Truly Measure
Stochastic oscillators are a technical analysis tool used to measure the momentum of a financial instrument and to identify potential overbought and oversold conditions. They are primarily used to gauge the speed and change of price movements. Here's what stochastic oscillators measure:
- Momentum: Stochastic oscillators measure the momentum of an asset's price. Momentum is the rate at which an asset's price changes, which can indicate the strength or weakness of the current trend.
- Overbought Conditions: Stochastic oscillators are used to identify when an asset is potentially overbought, meaning its price has risen too quickly and may be due for a pullback. An overbought condition suggests that buyers may be excessively bullish, and a reversal could be imminent.
- Oversold Conditions: Conversely, stochastic oscillators help identify when an asset is potentially oversold, indicating that its price has fallen too quickly and may be due for a rebound. An oversold condition suggests that sellers may be excessively bearish, and a reversal to the upside could occur.
- Trading Signals: Stochastic oscillators generate trading signals based on the interaction of two lines: the %K line and the %D line. When the %K line crosses above the %D line and both lines are in an oversold region, it can be considered a bullish signal. When the %K line crosses below the %D line and both lines are in an overbought region, it can be considered a bearish signal.
- Divergences: Stochastic oscillators are also used to detect bullish or bearish divergences. A bullish divergence occurs when the price makes lower lows, but the oscillator makes higher lows, indicating potential upward momentum. A bearish divergence happens when the price makes higher highs, but the oscillator makes lower highs, suggesting potential downward momentum.
Overall, stochastic oscillators are a valuable tool for traders and investors to understand the momentum of an asset's price and to make informed decisions regarding potential entry and exit points in the market.
What is the equation for calculating stochastics
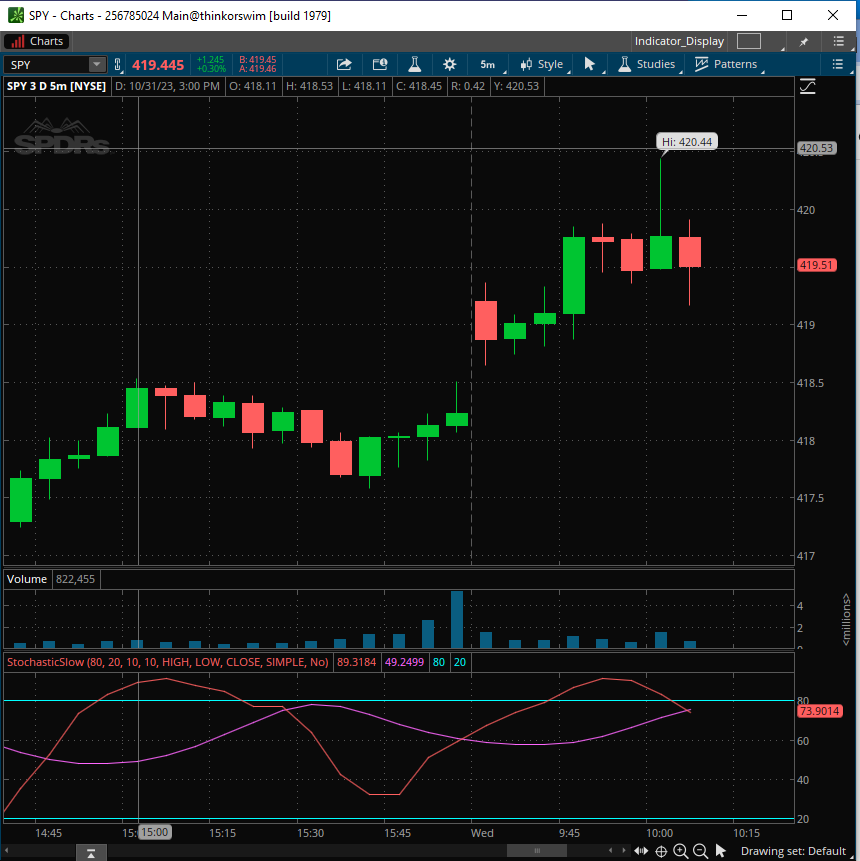
Stochastic oscillators are calculated using a series of mathematical formulas. The most common calculation involves two lines: %K and %D. Here's the basic equation for calculating stochastic oscillators:
- Calculate %K (Fast Stochastic):%K = [(Current Close - Lowest Low in "n" Periods) / (Highest High in "n" Periods - Lowest Low in "n" Periods)] * 100
- "Current Close" is the closing price of the asset for the current period.
- "Lowest Low in 'n' Periods" is the lowest low price observed in the last "n" periods (commonly 14 periods).
- "Highest High in 'n' Periods" is the highest high price observed in the last "n" periods.
- Calculate %D (Slow Stochastic):%D is a moving average of %K and is commonly a 3-period simple moving average of %K. So:%D = 3-period simple moving average of %KThis moving average helps smooth out the %K line to create the %D line.
After calculating %K and %D, you'll have two lines that oscillate between 0 and 100. Traders typically use these lines to identify overbought and oversold conditions and to generate trading signals, as mentioned in the previous response. The typical parameter for the "n" period in %K calculation is 14, but this can be adjusted to match your trading strategy or the asset's characteristics. Additionally, some charting software and trading platforms do the calculations automatically for you.
What time frame are stochastics best used?
Stochastic oscillators are a popular technical indicator used in technical analysis to assess the momentum and overbought or oversold conditions of a financial instrument. The choice of the best time frame for using stochastic oscillators can depend on your trading style and the asset you're analyzing. Here are some common time frames and how stochastic oscillators are used with them:
- Short-Term Trading (Intraday):
- For day traders or intraday traders, short time frames like 1-minute, 5-minute, or 15-minute charts are often used with stochastic oscillators.
- These short time frames are effective for identifying short-term overbought or oversold conditions and generating quick trading signals.
- Swing Trading (Daily to Weekly):
- Swing traders typically use daily or weekly charts with stochastic oscillators.
- This time frame helps identify potential reversals and swing points over a few days to a few weeks.
- Position Trading (Monthly):
- Position traders, who have longer investment horizons, might use monthly charts with stochastic oscillators.
- The monthly time frame helps identify long-term trends and overbought/oversold conditions for assets held over months or years.
- Scalping (Seconds to Minutes):
- Scalpers, who aim to make very short-term trades, may use seconds or 1-minute charts.
- In this case, stochastic oscillators can help make rapid decisions for very short-term gains.
The choice of the best time frame also depends on the asset being analyzed. More liquid and volatile assets (e.g., certain forex pairs) might be well-suited for shorter time frames, while less volatile assets (e.g., some large-cap stocks) could be analyzed effectively on longer time frames.
How would a day trader would use stochastics?
let's walk through an example of how a day trader might use stochastic oscillators in their trading strategy:
Scenario: You're a day trader focusing on trading stocks, and you're looking for short-term trading opportunities during the trading day. You've decided to use stochastic oscillators as one of your technical indicators.
Time Frame: You primarily use a 5-minute chart for your day trading activities.
Trading Objective: Your goal is to identify overbought and oversold conditions, as well as potential trend reversals, in order to make quick, intraday trades.
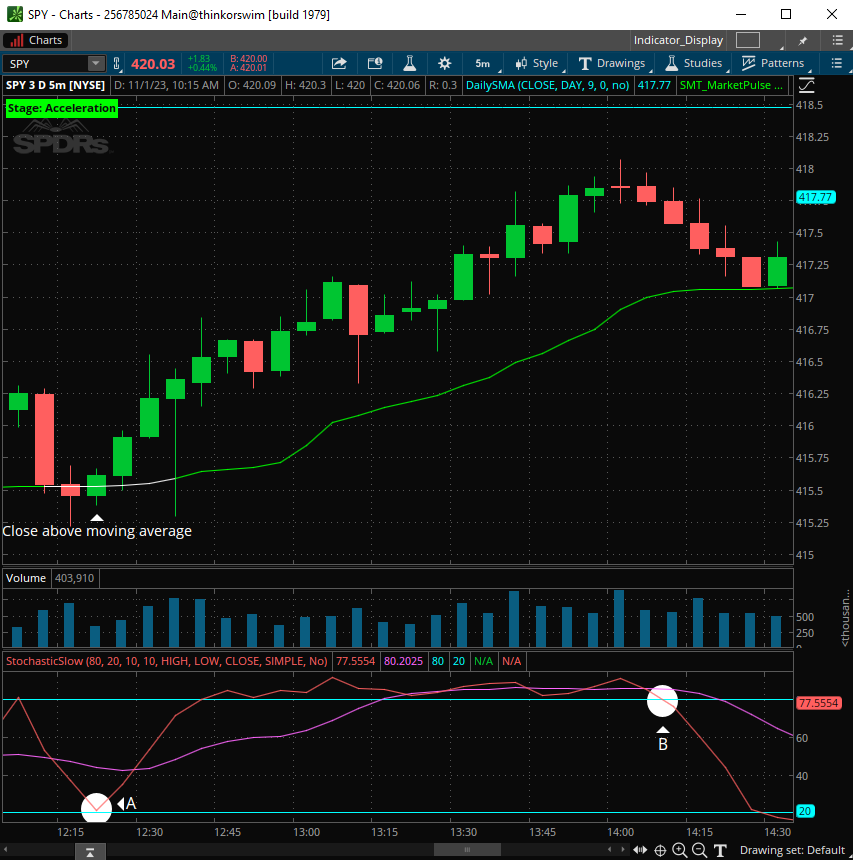
Step 1: Calculate Stochastic Oscillators
You start by adding the stochastic oscillator indicator to your 5-minute chart for the stock you're interested in trading.
Step 2: Identify Overbought and Oversold Conditions
- You monitor the stochastic oscillators and look for instances where the %K and %D lines cross over each other or reach extreme levels (usually 80 or above for overbought and 20 or below for oversold).
- If the %K line crosses above the %D line and both lines are in the overbought region, it can signal a potential bearish reversal, suggesting that the stock might be overextended.
- Conversely, if the %K line crosses below the %D line and both lines are in the oversold region, it can signal a potential bullish reversal, suggesting that the stock might be poised for an upward move.
Step 3: Generate Trading Signals
- When you identify a crossover or an overbought/oversold condition, you look for additional confirmation from other technical indicators, such as moving averages or support/resistance levels.
- If the stochastic oscillator aligns with your other indicators and suggests a trade in the direction you're considering, you take the trade.
Step 4: Manage the Trade
- Once you enter a trade, you set stop-loss and take-profit orders to manage risk and secure potential profits.
- You closely monitor the stock's price and the stochastic oscillator to make quick decisions. If the stochastic oscillator signals a reversal or divergence that contradicts your trade, you might consider exiting the trade.
Step 5: Repeat
- You continue scanning multiple stocks on your watchlist and repeat the process throughout the trading day to find multiple intraday trading opportunities.
- The key to success is disciplined and systematic trading, using stochastic oscillators as just one part of your overall trading strategy.
Keep in mind that trading with stochastic oscillators, like any trading strategy, carries risks. It's important to practice proper risk management, use additional technical and fundamental analysis, and be prepared for market volatility. Additionally, it's a good idea to backtest your strategy and gain experience through paper trading before committing real capital.
What is the short coming of the stochastics indicator?
The stochastic oscillator is a valuable technical indicator, but like all indicators, it has its limitations and shortcomings. Here are some of the main shortcomings of the stochastic oscillator:
- Whipsaws: Stochastic oscillators can produce false or premature signals, leading to whipsaws. A whipsaw occurs when the indicator generates a buy signal (crossing above 20) and then a sell signal (crossing below 80) in quick succession, which can result in unprofitable trades.
- Lagging Indicator: Stochastic oscillators are considered lagging indicators because they rely on past price data to calculate signals. By the time a signal is generated, the price move may have already occurred, potentially causing traders to miss out on part of the price action.
- Overbought and Oversold Conditions: Stochastic oscillators often indicate overbought or oversold conditions, but markets can remain in these states for extended periods. Relying solely on overbought/oversold signals can result in missed trading opportunities when trends persist.
- Market Conditions: In strongly trending markets, the stochastic oscillator may provide limited information. It may stay in the overbought or oversold regions for an extended time, making it less effective for trend-following strategies.
- Divergences Can Be Tricky: While stochastic oscillators can identify bullish or bearish divergences, interpreting them correctly can be challenging. Divergences do not always lead to price reversals, and misinterpretations can lead to losses.
- Parameter Sensitivity: The effectiveness of stochastic oscillators can vary with different parameter settings (e.g., changing the number of periods for %K and %D). Traders need to adjust these parameters based on the asset's characteristics and trading objectives, which can be a subjective process.
- Not Suitable for All Assets: Stochastic oscillators may be less effective for some asset classes, such as highly volatile or thinly traded securities.
- Should Be Used with Other Indicators: To mitigate the limitations of stochastic oscillators, it's advisable to use them in conjunction with other technical indicators and analysis methods. Relying solely on stochastic signals can be risky.
- Not a Standalone Solution: Stochastic oscillators are just one tool in a trader's toolkit. They should be part of a comprehensive trading strategy that includes risk management, fundamental analysis, and other technical indicators.
In summary, while stochastic oscillators are valuable for identifying momentum and overbought/oversold conditions, they have limitations that traders need to be aware of. To overcome these limitations, traders often combine stochastic signals with other forms of analysis and practice prudent risk management.
The effectiveness of stochastic oscillators can vary depending on market conditions and the chosen time frame. It's often beneficial to combine stochastic oscillator signals with other technical indicators and analysis methods for more robust trading decisions. Additionally, using multiple time frames in your analysis can provide a more comprehensive view of market conditions and potential trade setups.
Disclaimer: This material is provided for educational and entertainment purposes only. It does not constitute trading or investment advice.