The Wyckoff Method: Decoding The Secret Market Phases on a Daily Time Frame
Richard D. Wyckoff, a pioneer in technical analysis and trading, left behind a legacy that continues to influence the way traders analyze and make decisions in financial markets. Central to his methodology are the four key stages of price movement: Accumulation, Markup (Advancing Phase), Distribution, and Markdown (Declining Phase). These stages offer valuable insights into the intentions of market participants and can be particularly useful when analyzed on a daily timeframe.
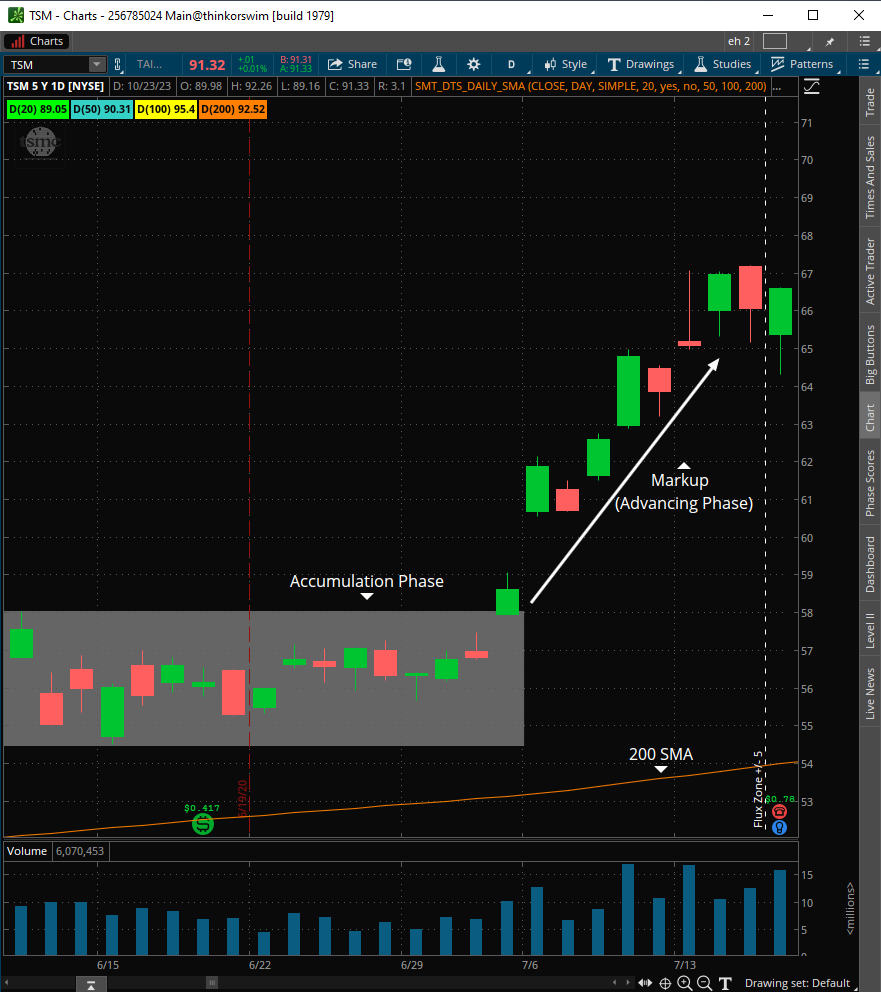
TSM was trading within a relatively tight range starting approx. June 10th, 2020, with professionals accumulating positions. The range-bound behavior during this period indicated smart money's quiet accumulation. Then on July 2nd, 2020 the markup phase followed the accumulation, with TSM experiencing a sustained uptrend. Prices were rising noticeably, marked by higher highs and higher lows. At this time TSM saw a strong bullish surge.
Accumulation: The Smart Money Gathers
Accumulation is the initial stage where smart money, often institutional and experienced traders, quietly accumulate positions. This phase is marked by relatively stable prices as professionals acquire assets without causing noticeable price increases. Wyckoff himself believed that understanding the accumulation phase was crucial for successful trading.
On a daily chart, accumulation is represented by a period of sideways or horizontal price movement. Traders might observe a series of doji candles or small trading ranges, indicating indecision in the market. Examples could be seen in stocks or cryptocurrencies where prices move within a tight range, usually for several weeks or even months. Please note that these phases are not always precisely defined and can overlap.
Markup (Advancing Phase): The Uptrend Takes Off
Following the accumulation phase, the uptrend starts to gain momentum in the markup or advancing phase. Prices begin to rise more prominently as the asset experiences a bullish surge. This is the stage where the smart money begins to cash in on their earlier accumulation.
On a daily chart, the markup phase appears as a clear and sustained uptrend. You'll notice higher highs and higher lows as prices climb. This stage is often characterized by robust trading volumes and strong bullish candlestick patterns. It's a time when traders may ride the trend and attempt to capture profits.
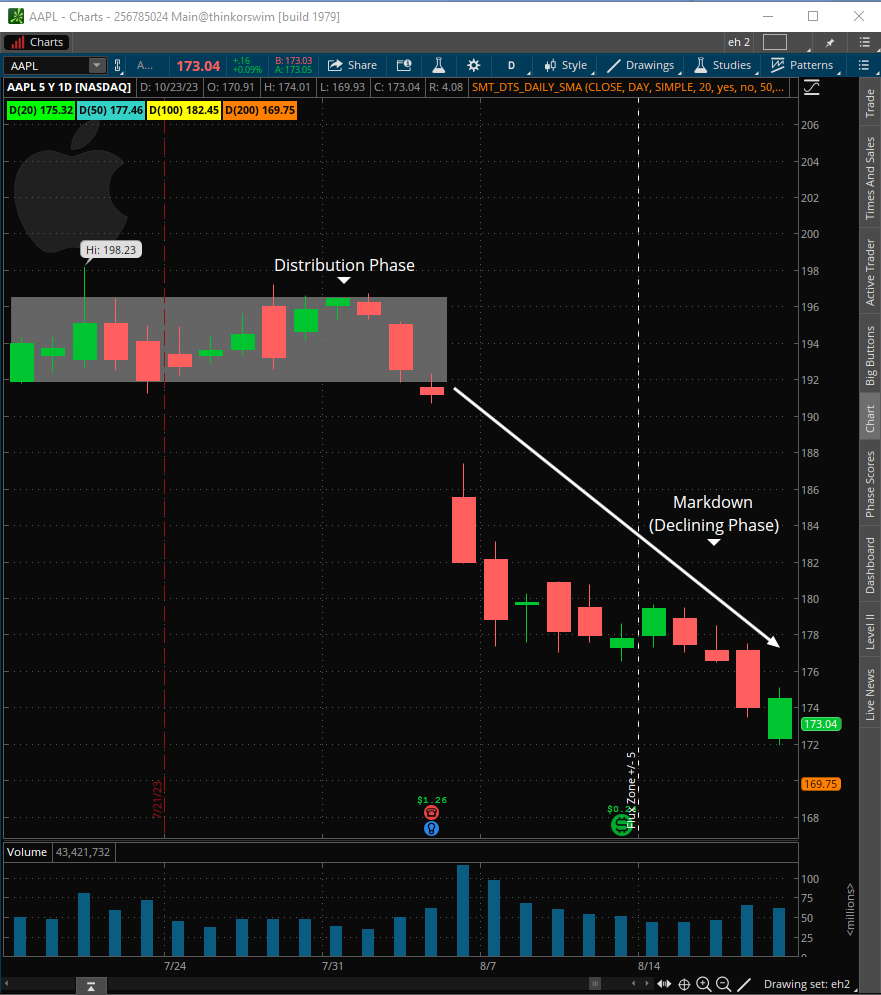
Beginning approx. July 17, 2023 smart money began to distribute or sell their accumulated positions. Prices may have become range-bound, and there might have been indications of weakening bullish sentiment. Approx. Aug. 3rd, 2023 began the markdown phase represented by a significant decline in prices as distribution becomes more apparent. There is a clear and sustained downtrend. The asset's prices form lower highs and lower lows, and the overall sentiment turns bearish.
Distribution: Smart Money Takes Profits
In the distribution phase, smart money starts distributing or selling their accumulated positions. Prices may become range-bound, and there might be indications of weakening bullish sentiment. This is when the general public often becomes aware of the asset's potential and begins to buy, unaware of the impending shift.
On a daily chart, distribution is typically recognized by sideways movement or a weakening uptrend. The asset's price may start to form a trading range, and you may observe lower highs and an increase in selling pressure. It's a time when traders following the Wyckoff Method may consider taking profits and preparing for a potential downturn.
Markdown (Declining Phase): A Reversal Takes Shape
The markdown or declining phase is the counterpart to the markup phase. Prices start to fall as the distribution becomes more apparent. Panic may set in among the general public, resulting in a significant decline in prices.
On a daily chart, the markdown phase is marked by a clear and sustained downtrend. Prices form lower highs and lower lows, and the overall sentiment is bearish. It's a phase when traders often seek to short-sell or exit long positions as the asset's value decreases.
The Wyckoff Method serves as a valuable tool for traders looking to gain insight into market dynamics and make informed trading decisions. By carefully examining price movements on a daily timeframe and recognizing the distinctive characteristics of each stage, traders can better understand the intentions of smart money and market sentiment, ultimately improving their ability to make profitable trades.
Disclaimer: This material is provided for educational and entertainment purposes only. It does not constitute trading or investment advice.