Treasury Yield Spreads
Treasury Yield Spread Analysis
Exploring the Enigmatic World of Yield Curves and Their Economic Implications
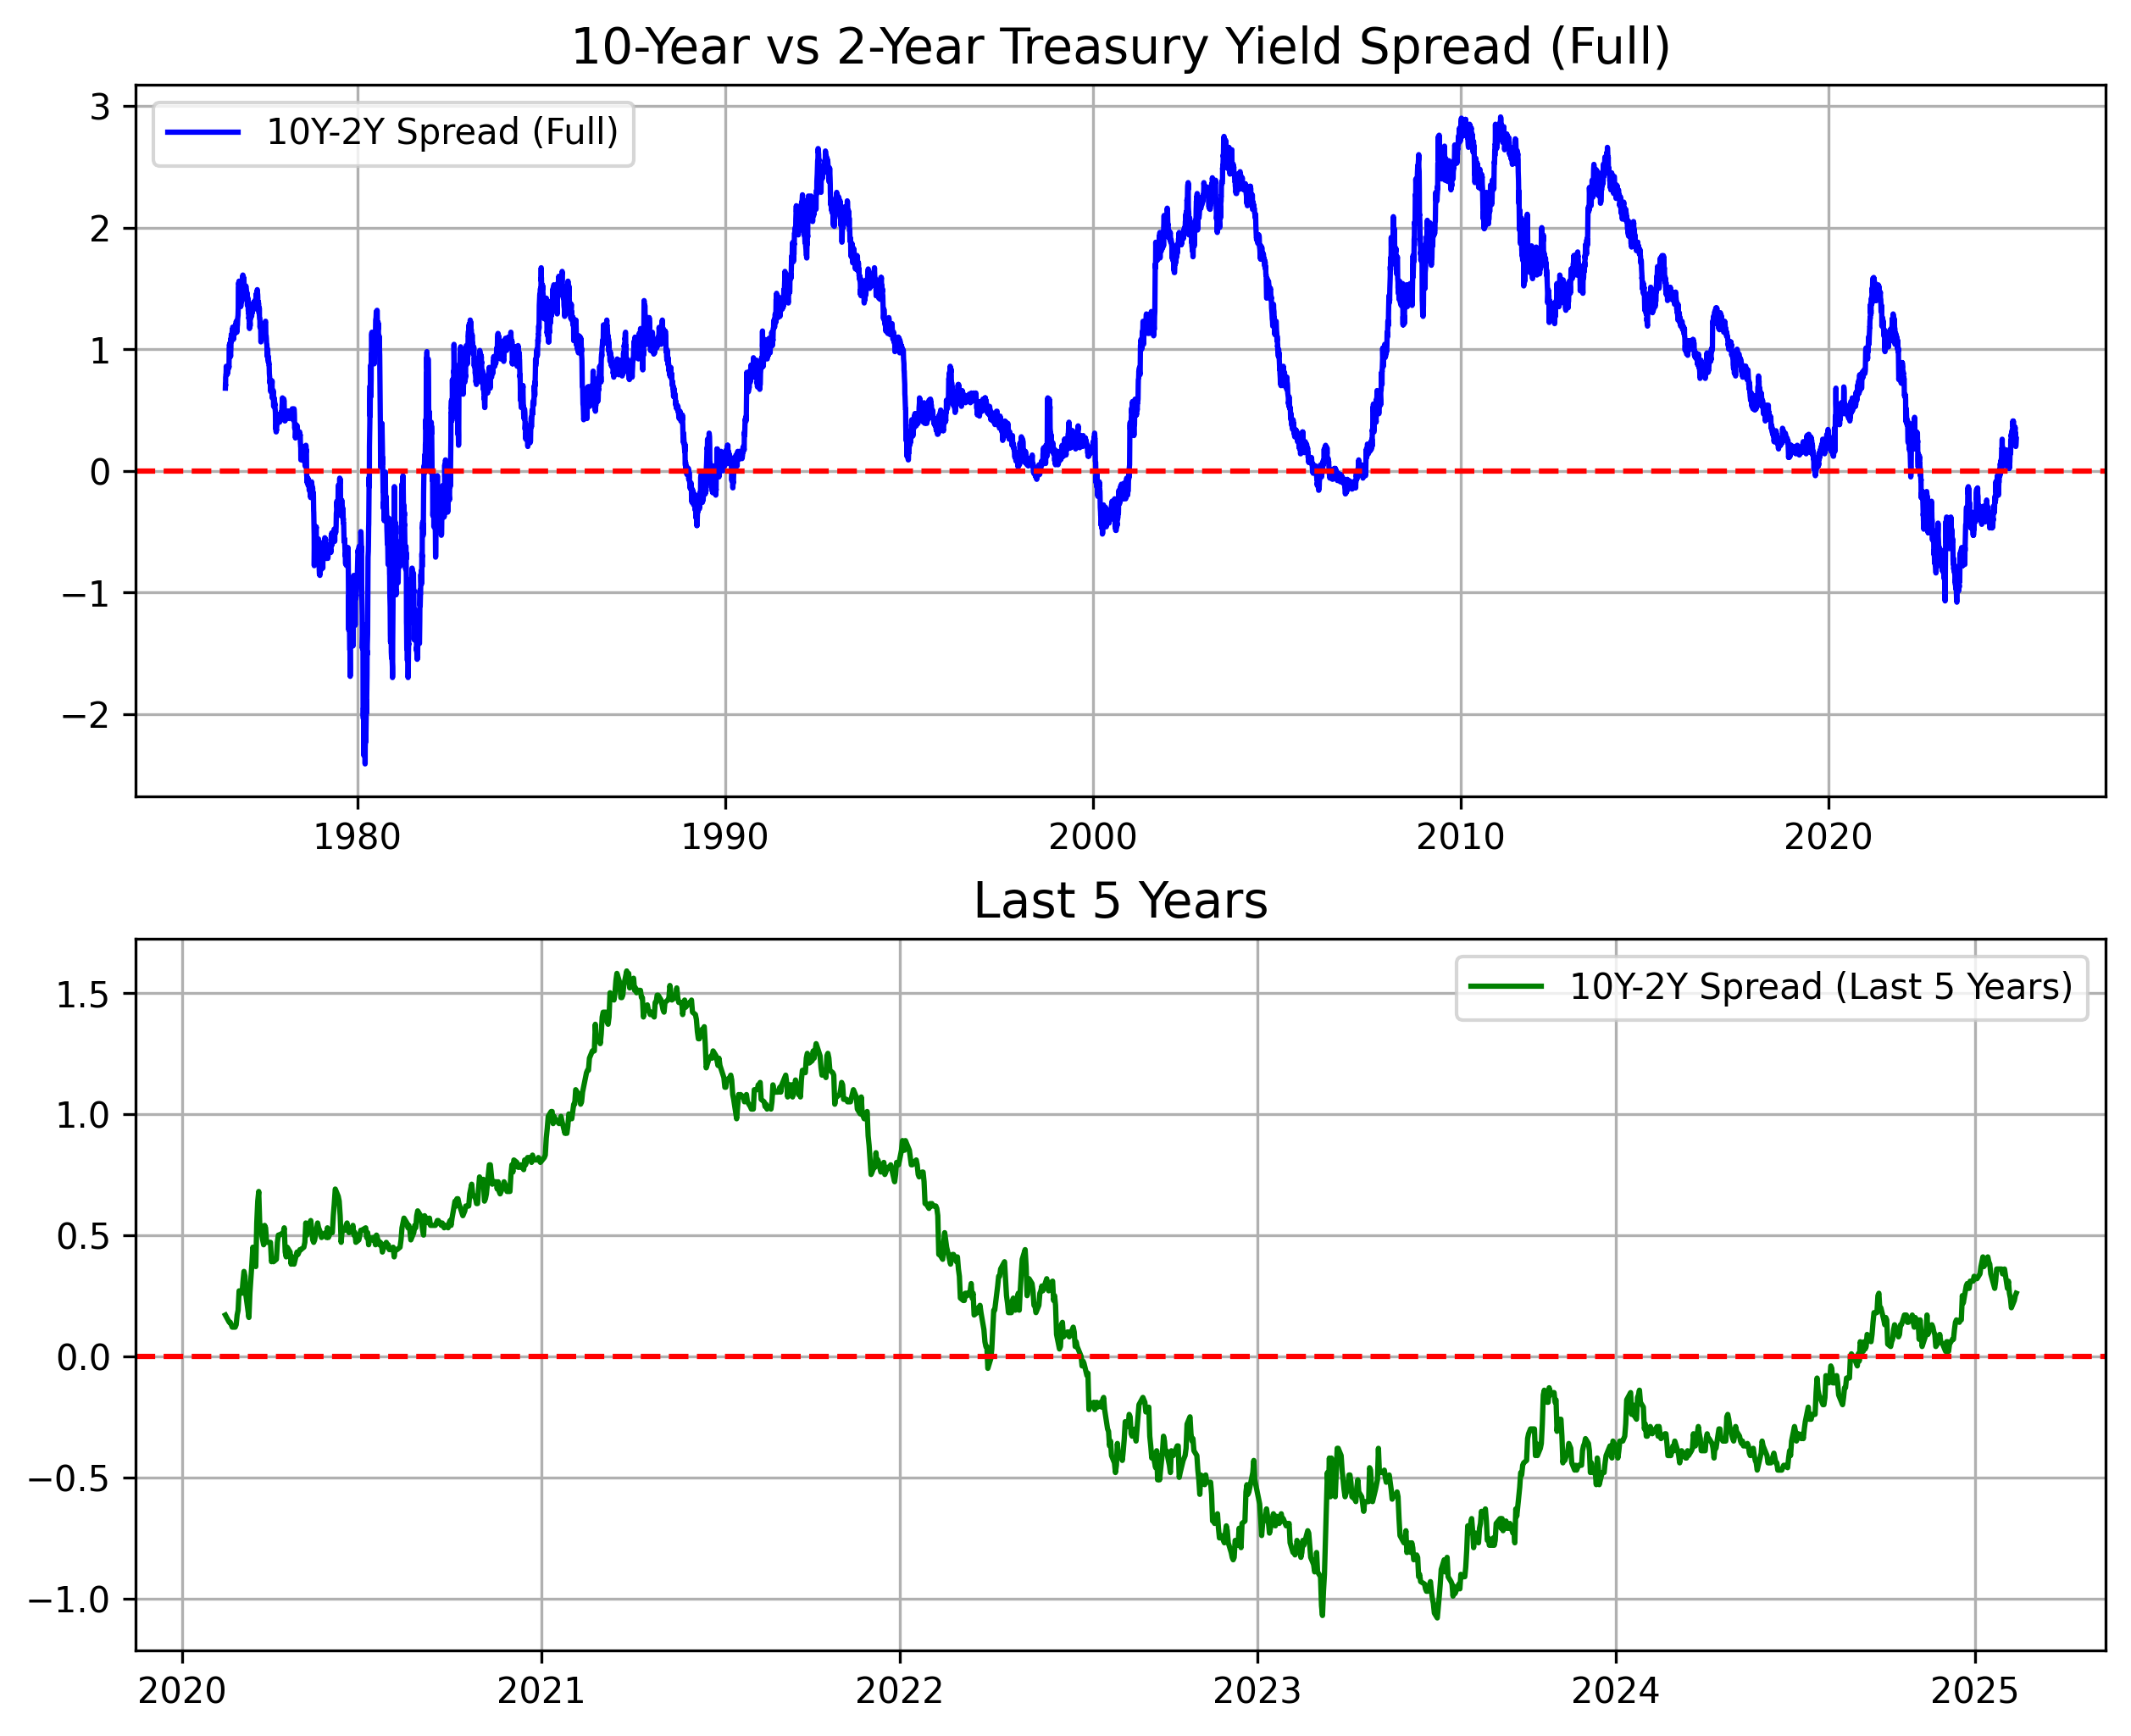
Yield curves, particularly the spread between long-term and short-term government bonds, serve as a barometer for the economic climate. The 10-Year vs. 2-Year Treasury spread, for example, is a critical metric monitored by economists and financial market aficionados for insights into future economic trends.
An Inverted Yield Curve: A Foreboding Signal? An inverted yield curve, where long-term rates fall below short-term rates, is widely regarded as an ominous indicator of future economic strife. Historically, such inversions in the 10Y-2Y spread have been reliable harbingers of economic downturns. Remarkably, every instance of inversion in recent decades has been followed by a U.S. recession, underscoring its predictive power.
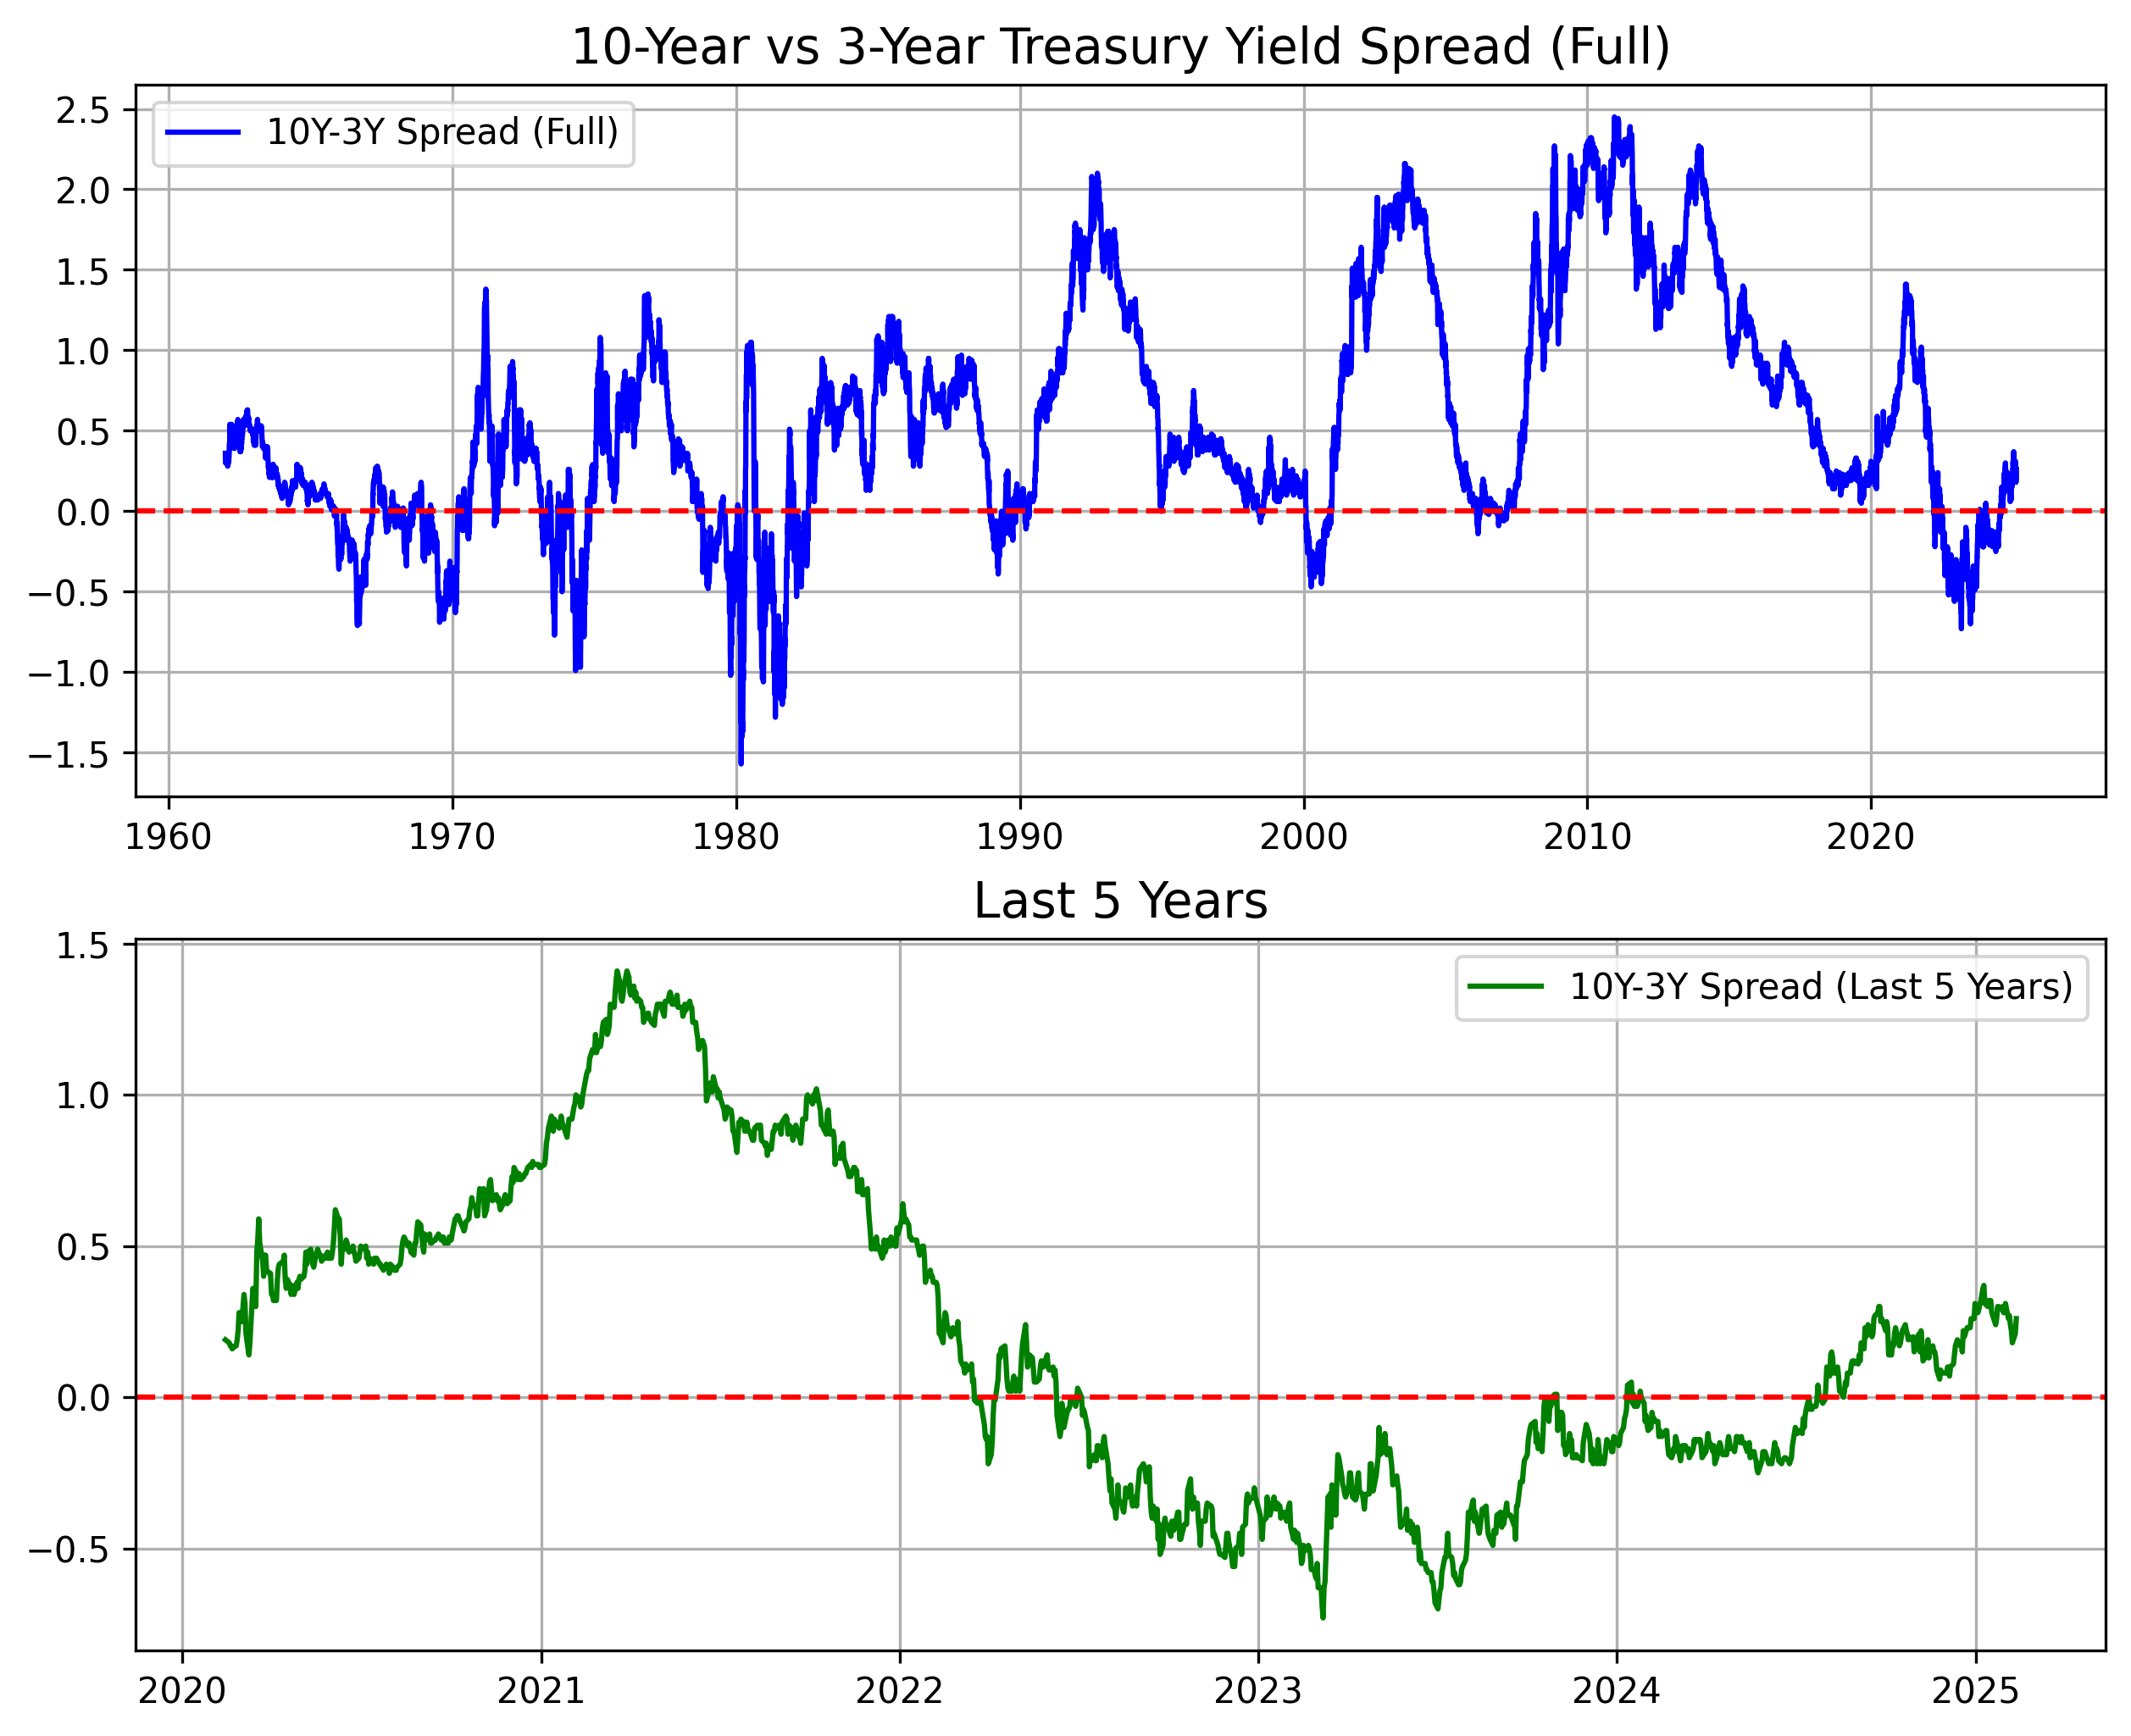
Deciphering the 10Y-3Y Spread for Additional Insights While the 10Y-2Y spread is well-followed, the 10Y-3Y spread offers nuanced views into the bond market's expectations for medium-term economic performance. This spread helps decode shifts in growth, inflation, and rate expectations over a nearer horizon than the 10Y-2Y, providing a more granular perspective on economic sentiments.
Historical Insights and Noteworthy Trends
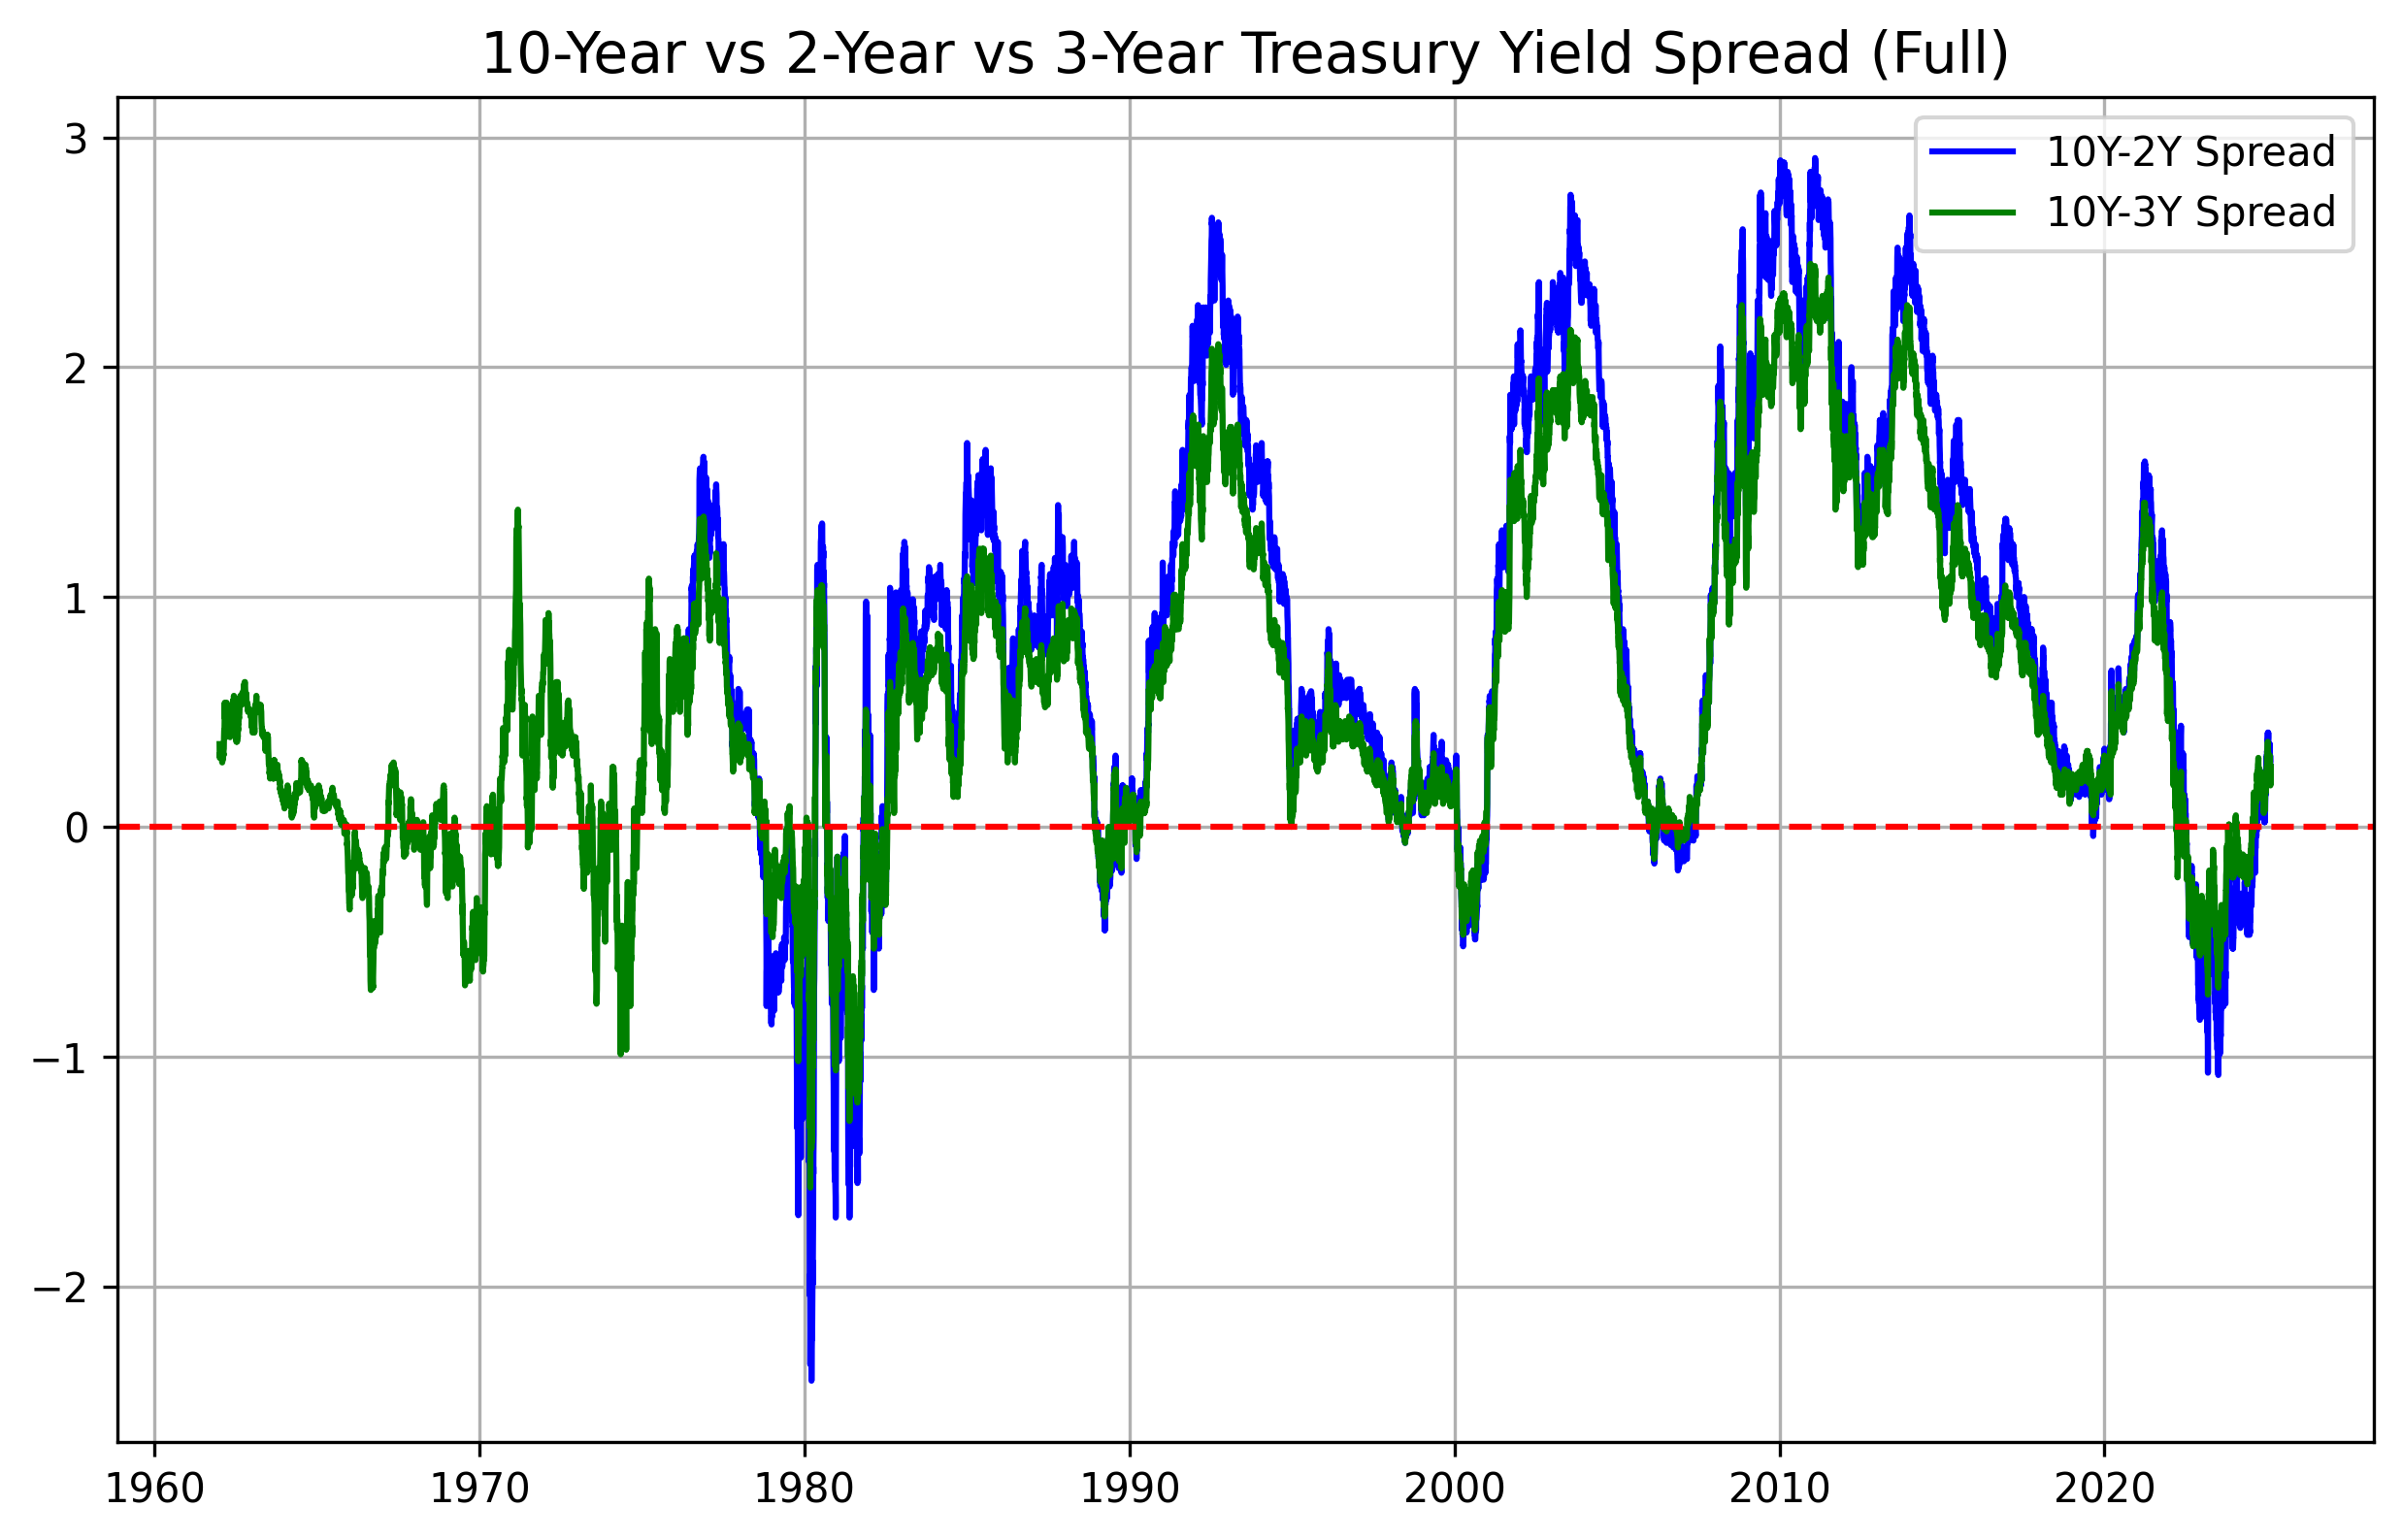
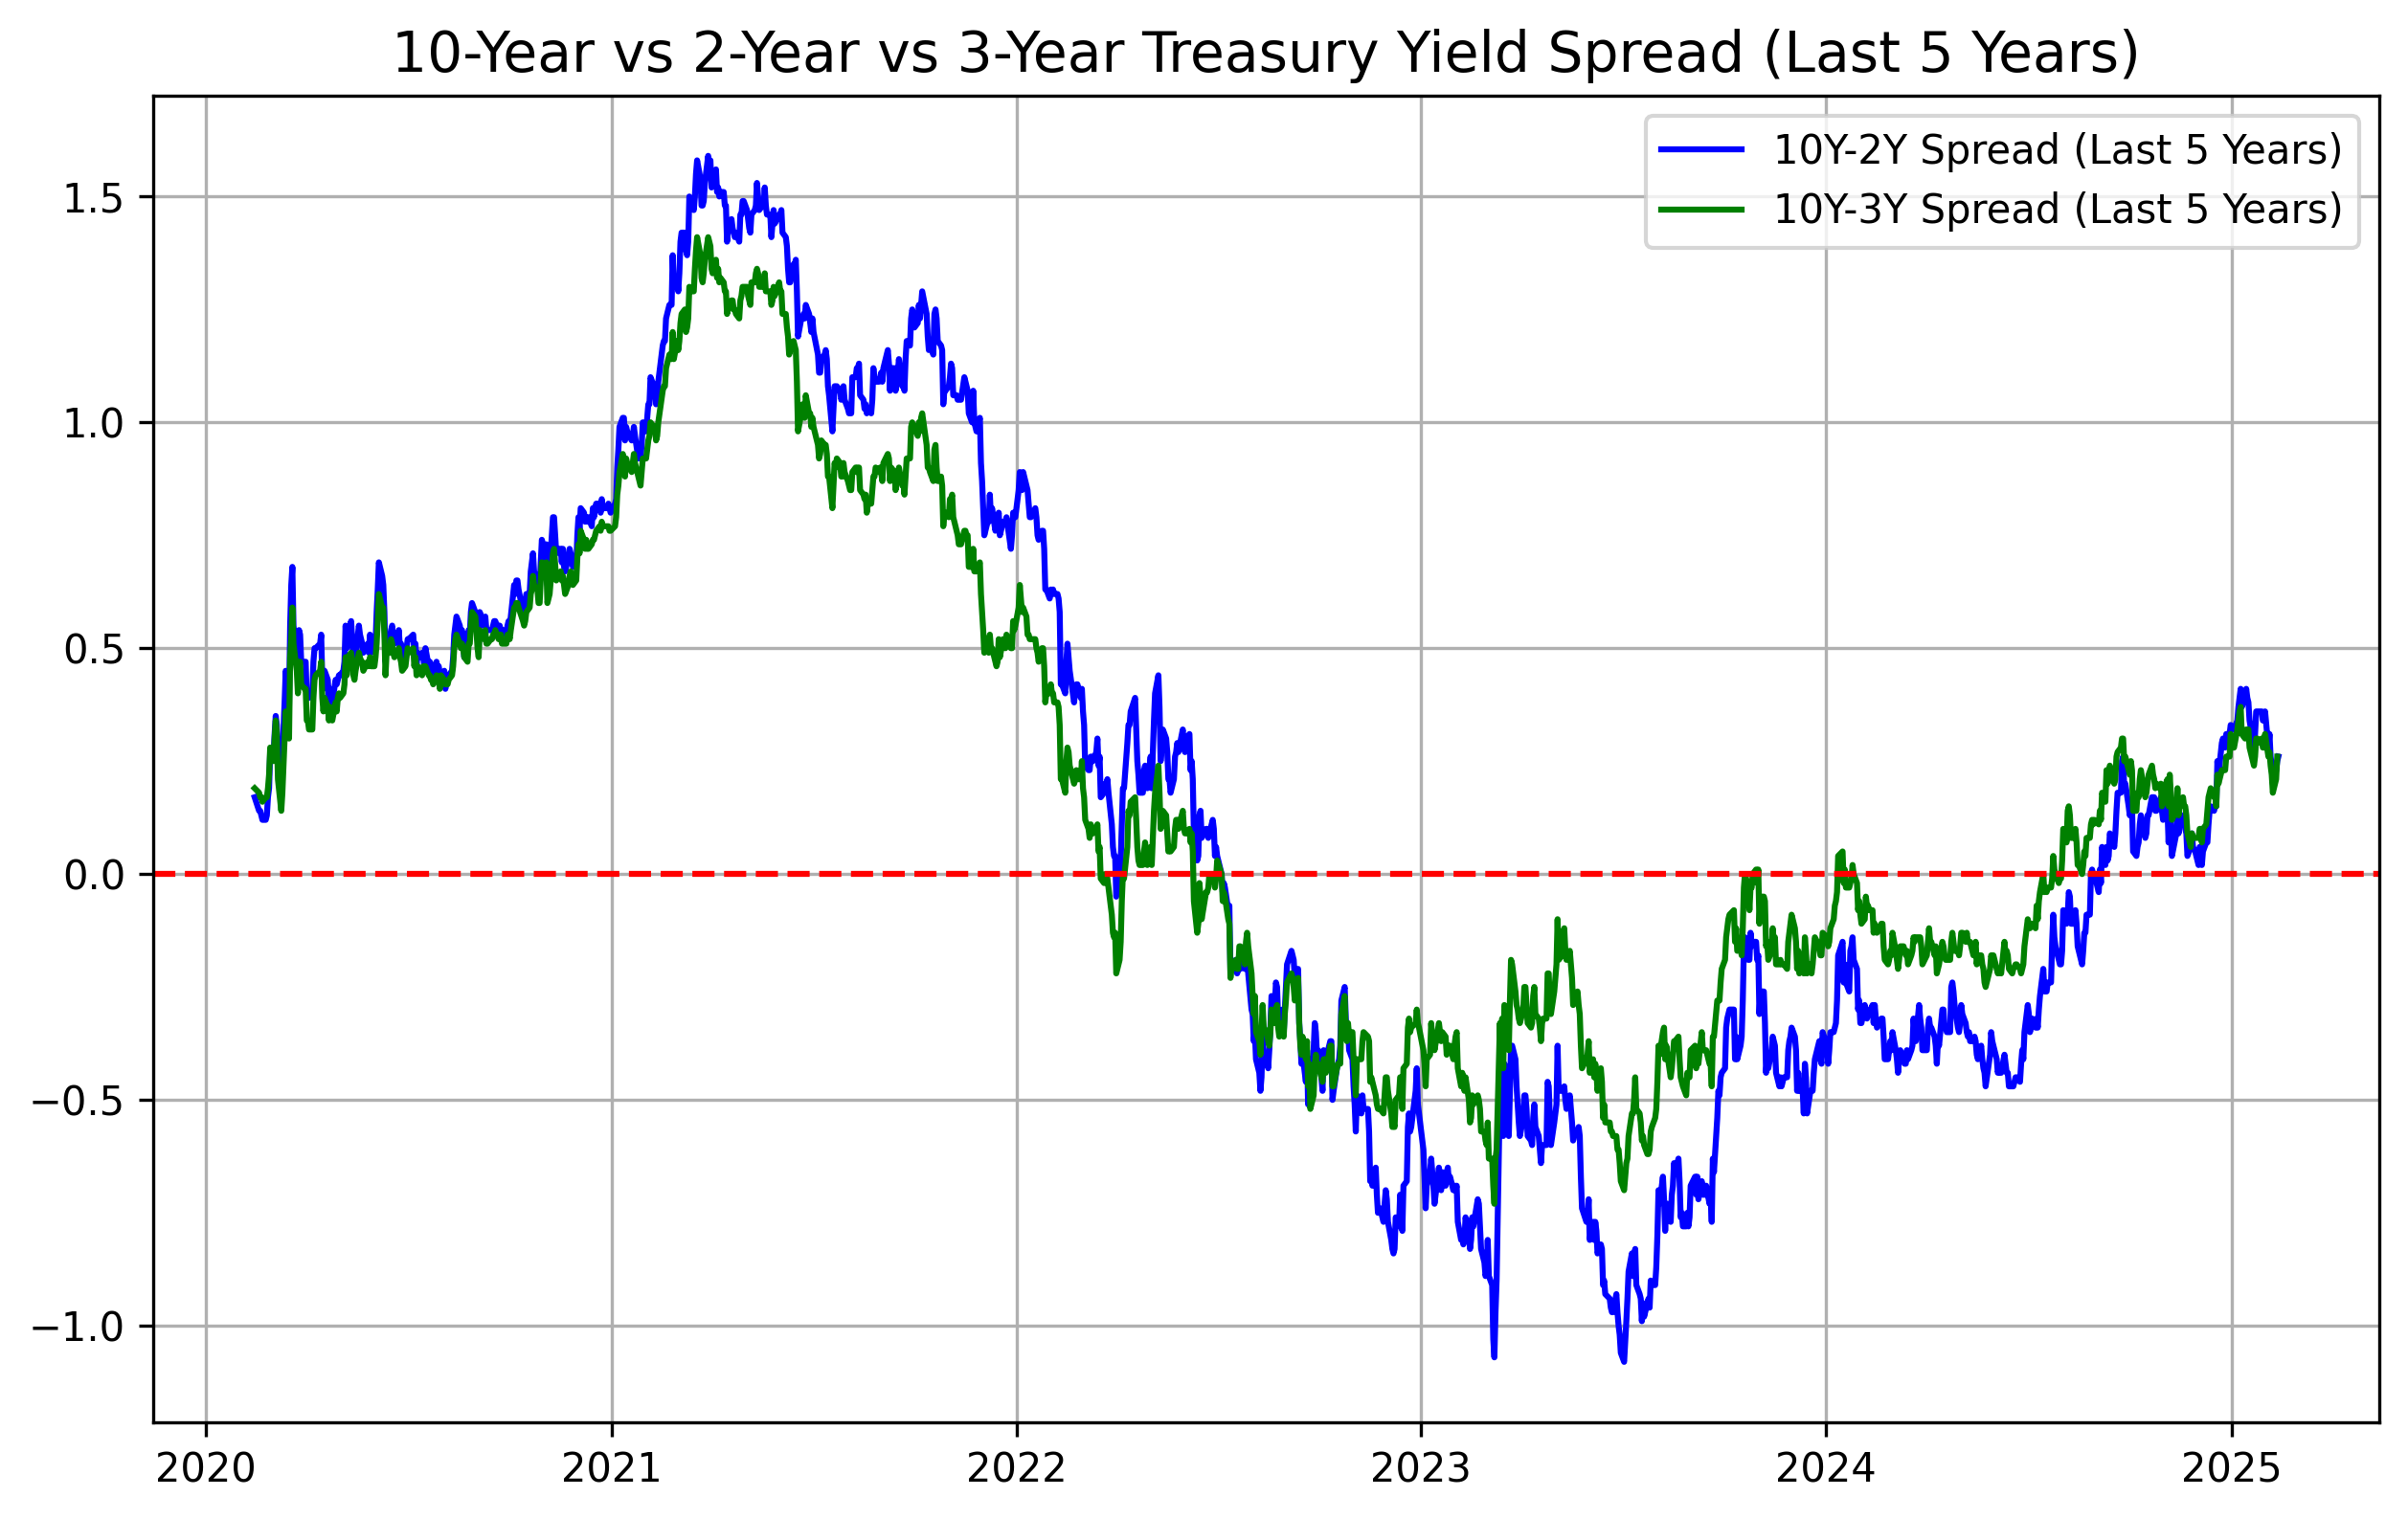
- Patterns of Inversion: Both the 10Y-2Y and 10Y-3Y spreads have experienced inversions in recent years, signaling a heightened risk of recession or economic deceleration. These moments of inversion are critical signals watched by market strategists and policymakers alike.
- Medium-Term vs. Long-Term Dynamics: The 10Y-2Y spread offers a classic view of short-term versus long-term rate expectations, but the 10Y-3Y spread captures the medium-term economic fluctuations. This has shown considerable volatility, reflecting shifting market dynamics and economic forecasts.
- A Five-Year Review: Over the last five years, these spreads have displayed dramatic swings, with periods of inversion pointing to potential economic challenges. These fluctuations are not merely numbers but are indicative of deeper economic forces at play, often followed by phases of recovery as market conditions and investor sentiments evolve.
10-Year vs 2-Year Treasury Yield Spread (Full and Last 5 Years)
10-Year vs 3-Year Treasury Yield Spread (Full and Last 5 Years)
Overlay of 10-Year vs 2-Year and 10-Year vs 3-Year (Full)
Overlay of 10-Year vs 2-Year and 10-Year vs 3-Year (Last 5 Years)
Disclaimer
The data presented in this analysis is obtained from publicly available sources and is intended for informational purposes only. While efforts have been made to ensure its accuracy, there are no guarantees regarding its completeness or timeliness. Please consult with a qualified financial professional before making any investment decisions. This data should not be considered financial advice.
Data Source: U.S. Federal Reserve Economic Data (FRED) API.
Data Last Retrieved on: 2025-01-20
Disclaimer: This material is provided for educational and entertainment purposes only. It does not constitute trading or investment advice.