Leveraging Market Breadth Indicators for Intraday Trading Success
Are you a new intraday trader looking to enhance your trading strategy? Market breadth indicators could be the missing piece of the puzzle you need to make informed and profitable trading decisions. In this article, we'll explore how intraday traders can use market breadth indicators to assess market sentiment, identify entry and exit points, and manage risk effectively.
Understanding Market Breadth Indicators
Before diving into how to use market breadth indicators, let's briefly explain what they are:
Market breadth indicators provide a snapshot of the overall health and sentiment of the stock market. They help traders gauge whether most stocks are advancing or declining and whether there's buying or selling pressure in the market. Common market breadth indicators include the Advance-Decline Line ($ADD), $TICK, and $VOLD.
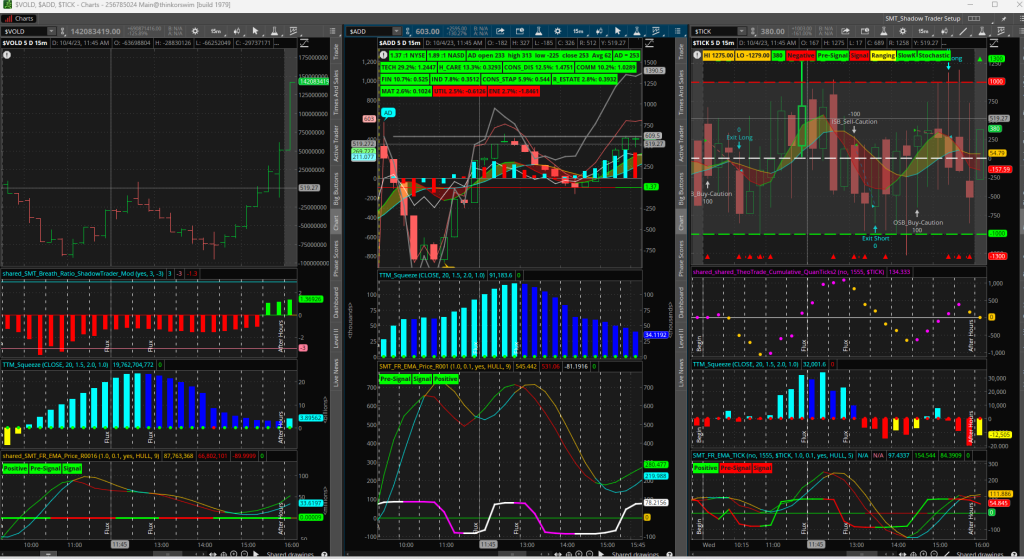
$VOLD, $ADD, and $TICK
$VOLD, $ADD, and $TICK are all market breadth indicators used in the world of stock trading and technical analysis. These indicators provide insights into the overall health and sentiment of the stock market by analyzing the number of advancing and declining issues and the volume of trades.
- $VOLD (Volume Breadth):
- $VOLD is a market breadth indicator that focuses on volume. It measures the net volume of advancing stocks minus the net volume of declining stocks.
- Positive $VOLD values suggest that more volume is associated with advancing stocks, indicating bullish sentiment.
- Negative $VOLD values suggest that more volume is associated with declining stocks, indicating bearish sentiment.
- $ADD (Advance-Decline Difference):
- $ADD is another market breadth indicator that looks at the difference between the number of advancing stocks and declining stocks in a given market or index.
- Positive $ADD values mean that there are more stocks advancing than declining, indicating bullish sentiment.
- Negative $ADD values mean that there are more stocks declining than advancing, indicating bearish sentiment.
- $TICK (NYSE Tick Index):
- $TICK measures the number of stocks on the New York Stock Exchange (NYSE) that are ticking up (trading on an uptick) minus the number of stocks that are ticking down (trading on a downtick) at a given moment.
- Positive $TICK values suggest more stocks are trading on upticks, indicating short-term buying pressure.
- Negative $TICK values suggest more stocks are trading on downticks, indicating short-term selling pressure.
These indicators are often used by traders and investors to gauge the overall market sentiment and to make short-term trading decisions. However, they are most effective when used in conjunction with other technical and fundamental analysis tools. It's important to note that market breadth indicators like $VOLD, $ADD, and $TICK are typically more relevant for short-term trading rather than long-term investing.
1. Confirming Market Direction
As an intraday trader, you want to be on the right side of the market trend. Market breadth indicators can help you do just that. Here's how:
- Confirmation: Market breadth indicators can confirm the direction of the broader market. For instance, if major indices like the S&P 500 and NASDAQ are trending upward, but the Advance-Decline Line is declining, it might signal weakness beneath the surface.
2. Identifying Overbought and Oversold Conditions
Knowing when the market is overbought or oversold is crucial for timing your trades:
- Overbought: If a market is overbought, meaning it has seen a significant uptrend and is due for a pullback, breadth indicators might show more declining issues and negative $TICK values.
3. Divergence Signals
Divergence between market breadth indicators and price movements can be a potent signal:
- Divergence: For instance, if the S&P 500 is making higher highs, but the Advance-Decline Line is making lower highs, it suggests that the rally may lack breadth and could be vulnerable to a reversal.
4. Intraday Entry and Exit Points
Now, let's put these concepts into action with an example of how an intraday trader can use market breadth indicators:
Intraday Trading Example
Scenario: You're an intraday trader looking to day trade the S&P 500 E-mini futures contract (ES).
- Assess Market Breadth: Before the trading session begins, review market breadth indicators such as the Advance-Decline Line and $TICK. Positive trends suggest bullish sentiment.
- Identify Entry Points: During the trading day, watch for opportunities to enter long (buy) positions in ES futures. Look for positive $TICK values, which can confirm your entry decisions.
- Manage Risk: Use breadth indicators to help manage risk. If you're in a long position and $TICK turns negative, consider tightening your stop-loss or exiting the position.
- Confirm Trends: Throughout the day, use breadth indicators to confirm the overall trend. If ES is rising but the Advance-Decline Line is declining, be cautious.
- Exit Strategies: Determine when to exit positions. Positive breadth indicators might encourage you to hold onto a winning trade, while negative indicators could signal an exit.
Remember, market breadth indicators are just one part of your trading toolkit. Combine them with technical analysis, chart patterns, and risk management to make well-informed decisions.
Conclusion
Market breadth indicators can provide valuable insights for intraday traders. They help you confirm market direction, identify overbought and oversold conditions, spot divergence signals, and refine your entry and exit strategies. Incorporate these indicators into your trading plan, adapt to market conditions, and always prioritize risk management for intraday trading success.
Happy trading!
Disclaimer:
The information provided in this article is for educational and informational purposes only. Intraday trading involves a high level of risk and may not be suitable for all investors. Trading financial instruments, including stocks and futures contracts, carries inherent risks, and it's possible to incur losses that exceed your initial investment.
Before engaging in intraday trading, it is essential to fully understand the risks involved and consider your risk tolerance. It's advisable to consult with a qualified financial advisor or conduct your research and due diligence before making any trading decisions.
The author and the platform providing this information do not make any representations or warranties regarding the accuracy, completeness, or suitability of the information provided. All trading decisions should be based on your individual analysis and judgment.
Past performance is not indicative of future results, and there are no guarantees of profit or success in the financial markets. The author and the platform disclaim any liability for any financial losses or damages incurred as a result of the use of the information presented in this article.
Trading in financial markets involves substantial risk, and you should carefully consider your financial situation and consult with a qualified professional before making any trading decisions.
Disclaimer: This material is provided for educational and entertainment purposes only. It does not constitute trading or investment advice. Hypothetical performance has inherent limitations.