Trading with Bollinger Bands: A Comprehensive Guide
Bollinger Bands are a technical analysis tool developed by John Bollinger in the 1980s. They are used to measure the volatility of a security's price and to identify potential buy and sell signals.
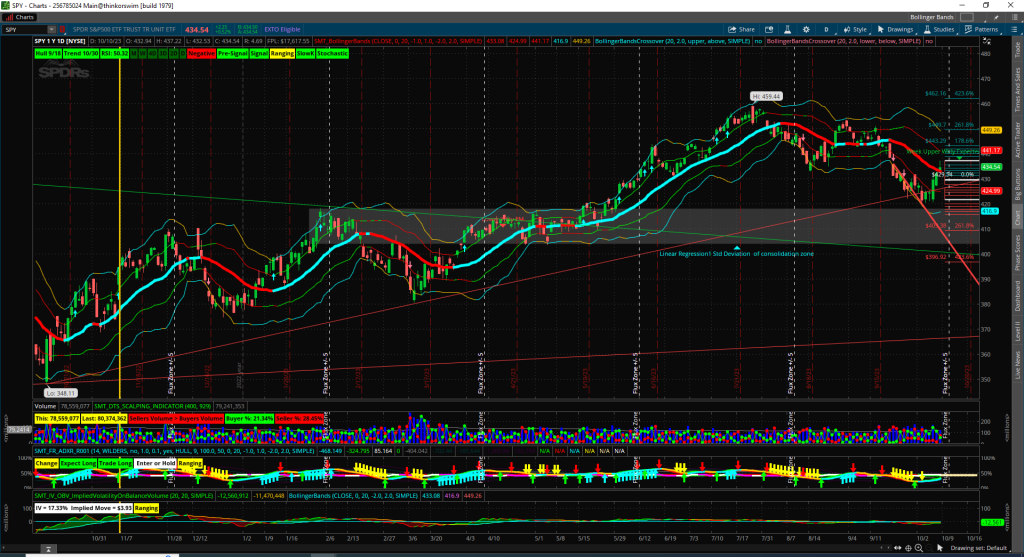
The outer bands are +/- 2 Std. Dev. are colored cyan (increasing) / yellow (decreasing).
The center cyan / red bold line represents the average.
+/- 1 Std. Dev. lines are green / red.
Bollinger Bands are plotted as two lines above and below a moving average of the security's price. The upper band is two standard deviations above the moving average, and the lower band is two standard deviations below the moving average. The standard deviation is a measure of volatility, so the Bollinger Bands will widen when the security's price is volatile and narrow when the security's price is less volatile.
Bollinger Bands can be used to identify potential buy and sell signals in a number of ways. For example, a trader might buy a security when the price falls below the lower band, and sell the security when the price rises above the upper band. A trader might also look for other technical indicators, such as candlestick patterns, to confirm the signals generated by the Bollinger Bands.
Benefits of using Bollinger Bands
Bollinger Bands offer a number of benefits to traders, including:
- Versatility:
- Multi-Asset Applicability: One of the key advantages of Bollinger Bands is their versatility. They can be effectively applied to a wide range of financial instruments, making them valuable for traders across various markets. Whether you're trading stocks, exchange-traded funds (ETFs), foreign exchange (Forex), or even cryptocurrencies, Bollinger Bands can assist in your analysis. This adaptability is particularly beneficial for traders who diversify their portfolios or seek opportunities in different asset classes.
- 2. Simplicity:
- Ease of Comprehension: Bollinger Bands are renowned for their simplicity and straightforward interpretation. The concept behind Bollinger Bands is easy to grasp, even for novice traders. The bands consist of three components: the middle band, which is typically a simple moving average (SMA), and the upper and lower bands, which are calculated based on the standard deviation of price. This uncomplicated structure allows traders to quickly integrate Bollinger Bands into their trading strategies without extensive technical analysis.
- 3. Effectiveness:
- Identifying Buy and Sell Signals: Bollinger Bands are particularly effective in identifying potential buy and sell signals. The bands can serve as a dynamic framework for understanding price volatility and potential reversal or breakout points. Key signals to look for include:
- Bollinger Squeeze: When the bands contract, it signifies low volatility and is often followed by a period of increased price movement. Traders can anticipate potential breakout opportunities during such squeezes.
- Price Touches Bands: When prices touch or pierce the upper or lower bands, it may signal overbought (near the upper band) or oversold (near the lower band) conditions. This can be a cue for potential reversals.
- Breakouts: A decisive move beyond the bands can suggest the beginning of a new trend or an extended price move. Traders often interpret such breakouts as signals to enter or exit positions.
- Risk Management: Bollinger Bands also assist in risk management. By assessing the width of the bands, traders can gauge the level of price volatility. Wider bands indicate higher volatility, prompting traders to adjust their risk exposure accordingly. Conversely, narrower bands signify lower volatility, which might prompt traders to consider more substantial positions.
- Trade Confirmation: Bollinger Bands are frequently used in conjunction with other technical indicators and chart patterns. The confluence of signals from different sources can provide more robust trade confirmations. For example, if a Bollinger Band breakout aligns with a bullish divergence on the Relative Strength Index (RSI), it can enhance the confidence in a trade.
- Adapting to Market Conditions: Bollinger Bands adapt to changing market conditions. In volatile markets, the bands widen, reflecting the increased price movement. During periods of reduced volatility, the bands contract. This adaptability ensures that the indicator remains relevant in various market scenarios.
- The versatility, simplicity, and effectiveness of Bollinger Bands make them a valuable tool in the trader's toolkit. They can help traders make informed decisions, manage risk, and increase the precision of their entries and exits. However, as with any trading tool, it's essential to combine Bollinger Bands with a comprehensive trading strategy and risk management to harness their full potential.
How to use Bollinger Bands for trading
There are a number of ways to use Bollinger Bands for trading. Here are a few examples:
1. Buy Signal:
- Oversold Conditions: When the price of a security falls below the lower Bollinger Band, it's regarded as an indication that the security is in an oversold condition. In other words, it may have experienced a significant downward price movement, possibly to an extent beyond what's justified by fundamentals or market sentiment.
Example: Oversold Condition
Suppose you're a trader looking at the daily price chart of Company X (let's call it XYZ Corp.), and you've applied Bollinger Bands with the standard parameters (20-day period and 2 standard deviations). Here's what you observe:
Date Range: The chart covers trading activity from January 1st to March 31st.
Bollinger Bands: The Bollinger Bands are displayed on the chart. The middle line is the 20-day moving average, and the upper and lower bands are two standard deviations away from the moving average.
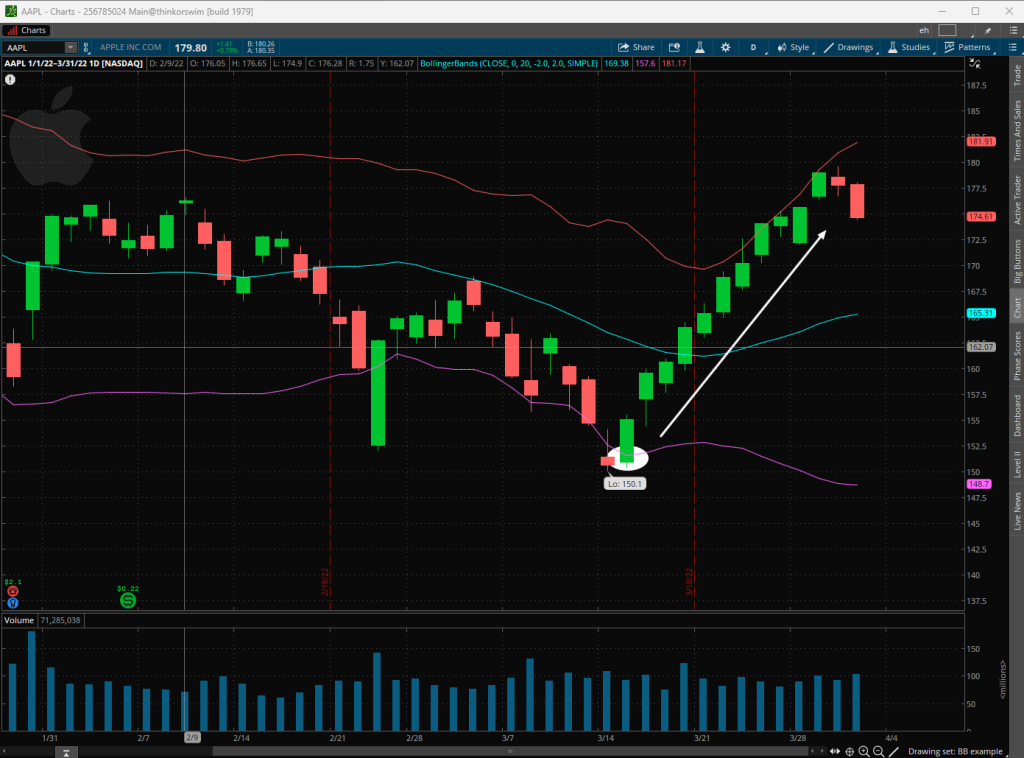
In this chart:
Bollinger Bands: The colored lines represent the Bollinger Bands. The upper band (red) is the top line, the lower band (purple) is the bottom line, and the middle line (cyan) is the moving average.
Price Movement: Notice how the price of AAPL gradually declines over the chart's time frame.
Oversold Condition: Specifically, let's focus on the period around March 15th. You can see that on that date, the price of AAPL fell significantly, touching or crossing below the lower Bollinger Band. This situation indicates an "oversold" condition. It suggests that the price may have experienced an excessive downward movement, possibly more than what's justified by market fundamentals or investor sentiment.
Buy Signal: This oversold condition serves as a potential "buy" signal. Intraday traders who use Bollinger Bands might interpret this as an opportunity to consider purchasing shares of AAPL. The idea is that the security's price has likely reached a level of support, where it's expected to bounce back or reverse its downtrend.
Please note that the example chart is a simplified illustration. In practice, traders often conduct additional analysis to confirm buy signals, such as examining other technical indicators or conducting fundamental research. Successful trading requires a well-rounded approach.
The image (chart) associated with this example is a visual representation of the oversold condition in the context of Bollinger Bands. It is provided for reference and explanatory purposes.
- Opportunity to Buy: This occurrence implies a potential buying opportunity. Traders and investors often interpret an oversold condition as a signal to consider purchasing the security. The assumption is that the price has reached a level of support where it's more likely to reverse or experience a bounce. However, this should not be the sole basis for a buy decision. It's advisable to complement this signal with other forms of analysis, such as fundamental research or confirmation from other technical indicators.
2. Sell Signal:
- Overbought Conditions: Conversely, when the price of a security rises above the upper Bollinger Band, it suggests that the security is in an overbought condition. This means that the price may have surged to a level that exceeds reasonable valuations or where buying pressure is excessive.
Example: Overbought Condition
Imagine you're monitoring the daily price chart of a well-known tech company, IBM. During your analysis, you've applied Bollinger Bands with the standard settings: a 20-day period and two standard deviations. Here's what you observe:
- Date Range: The chart covers trading activity from May 12th to June 23rd.
- Bollinger Bands: The Bollinger Bands are prominently displayed on the chart. The middle line represents the 20-day moving average, while the upper and lower bands are positioned 1.5 standard deviations away from the moving average.
Now, let's take a look at the chart:
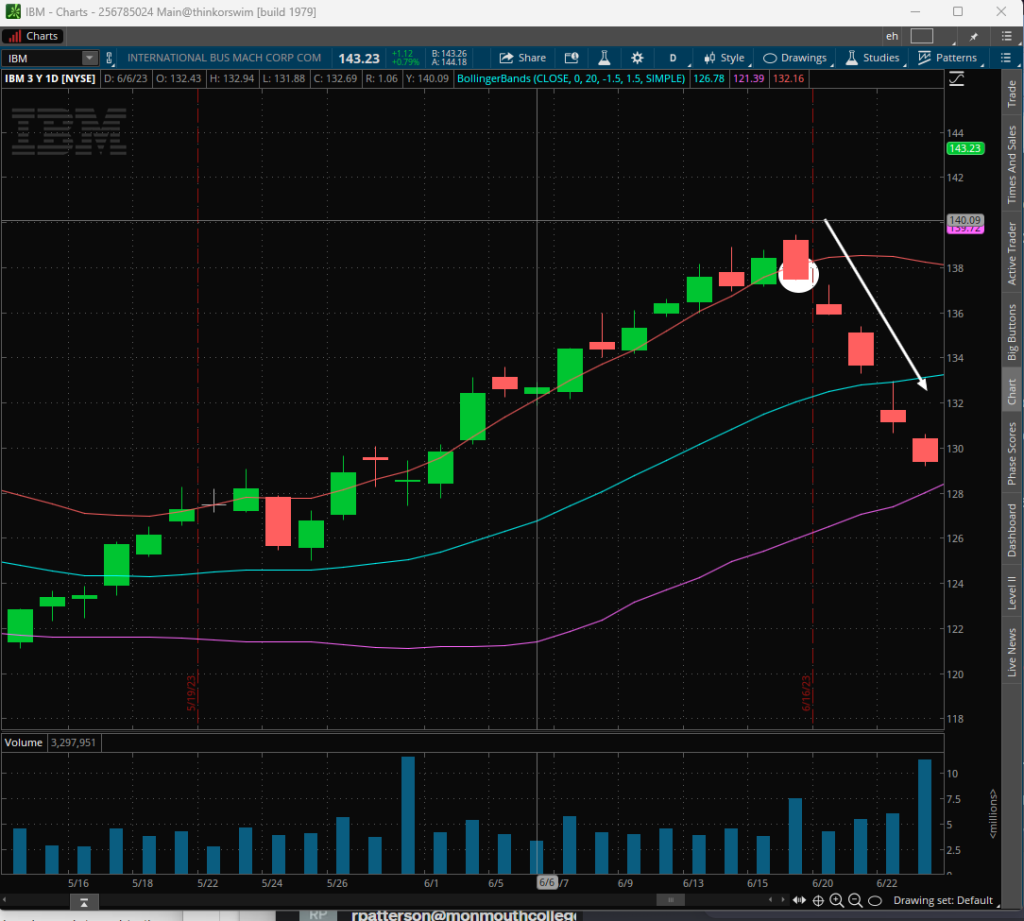
In this chart:
- Bollinger Bands: The red, cyan and purple lines denote the Bollinger Bands as before. The upper band (red) appears as the upper line, the lower band (purple) as the lower line, and the middle band (cyan) as the moving average.
- Price Trend: Observe how IBM's stock price gradually ascends over the chart's time frame.
- Overbought Condition: To zoom in on a specific period, let's focus on the date around June 16th. Here, you can see that the price of IBM has significantly increased, even crossing above the upper Bollinger Band. This scenario signifies an "overbought" condition, suggesting that the stock price may have surged to levels that are not sustainable based on fundamentals or investor sentiment.
- Sell Signal: The overbought condition is often seen as a potential "sell" signal. Day traders using Bollinger Bands might interpret this as an opportunity to consider selling IBM shares. The underlying idea is that the stock's price has likely reached a point of resistance, and a downward correction or reversal may follow.
It's crucial to emphasize that this is a simplified illustrative example. In real-world trading, traders conduct comprehensive analysis, often combining various technical and fundamental indicators. Moreover, trading decisions should be made cautiously, as significant price trends can persist for extended periods despite overbought conditions.
The provided image (chart) is a visual representation of the overbought condition within the context of Bollinger Bands. It's intended for educational and explanatory purposes.
- Opportunity to Sell: An overbought signal serves as a potential selling opportunity. Traders may decide to sell the security, expecting a price reversal or a downward correction. However, as with buy signals, it's essential to use this as a trigger for further analysis. Selling solely based on overbought conditions can be risky, as strong upward trends may persist for extended periods.
3. Squeeze Signal:
The Bollinger Band Squeeze is a notable signal that is keenly observed by traders using Bollinger Bands. It indicates a period of reduced price volatility and serves as a precursor to potential significant price movements. Let's dive into the details and provide an example with a visual representation.
- Volatility Contraction: The Bollinger Squeeze occurs when the Bollinger Bands contract or narrow. This indicates that the security is experiencing reduced price volatility and that a breakout in either direction is imminent.
- Anticipating Breakouts: Traders watch for squeezes as potential precursors to significant price movements. When the bands squeeze, it suggests pent-up market energy. As the squeeze continues, traders prepare for a potential breakout.
- Directional Ambiguity: The Bollinger Squeeze doesn't provide information about the direction of the impending breakout (up or down). Therefore, traders must remain open to both possibilities. Once a breakout occurs (the price moves decisively above the upper band or below the lower band), it confirms the direction.
Example: Bollinger Band Squeeze
Let's consider a fictional stock, XYZ Corporation. You're analyzing XYZ's price chart with Bollinger Bands applied. Here are the key elements:
- Date Range: The chart covers a three-month period from January to March.
- Bollinger Bands: The Bollinger Bands are prominently displayed. They consist of an upper band, a lower band, and a middle band representing the moving average.
In this example:
- Bollinger Bands: The chart displays the Bollinger Bands in blue. They begin to narrow significantly around the last week of February, creating what is commonly referred to as a "squeeze."
- Price Volatility: During the squeeze, the price of XYZ Corporation appears to be consolidating. Price fluctuations are limited, and the trading range becomes narrow.
- Market Energy: The Bollinger Squeeze signifies that market participants are indecisive, and there is pent-up energy in the market. The spring analogy is apt here; the more the bands contract, the greater the potential energy for a substantial price move.
- Anticipating Breakouts: Traders actively monitor Bollinger Squeezes as potential precursors to significant price movements. The tightening bands suggest that a breakout is imminent, but they do not provide information about the direction of the breakout (up or down). This directional ambiguity is why traders must remain open to both possibilities.
Trading the Breakout:
- To capitalize on a Bollinger Squeeze, traders prepare for a decisive breakout by setting entry orders both above and below the narrow trading range. These orders are designed to catch the price movement as soon as it occurs.
Directional Confirmation:
- Once the breakout happens, and the price moves decisively above the upper band or below the lower band, it confirms the direction of the impending move. Traders can then adjust their strategies accordingly.
The Bollinger Band Squeeze is a valuable tool for traders because it can identify periods of market consolidation and foreshadow potentially significant price swings. However, it is important to note that not all squeezes result in massive breakouts. Some may lead to minor moves or even reversals. Therefore, traders often use other technical and fundamental analysis methods to complement their trading decisions.
The provided image (chart) offers a visual representation of the Bollinger Band Squeeze scenario, which is essential for educational purposes.
These signals are integral to the use of Bollinger Bands as they offer insight into potential price reversals (buy and sell signals) and upcoming periods of high volatility (squeezes). However, it's important to emphasize that Bollinger Bands should not be used in isolation. They are most effective when incorporated into a comprehensive trading strategy that considers other indicators, chart patterns, and fundamental analysis.
Moreover, traders should always apply risk management techniques and be prepared for the possibility of false signals, where the price doesn't behave as anticipated. Bollinger Bands provide valuable guidance, but successful trading requires a holistic approach.
Limitations of Bollinger Bands
It is important to note that Bollinger Bands are not a perfect trading tool. They can generate false signals, and they should not be used in isolation. Traders should always use multiple technical indicators and risk management techniques to make informed trading decisions.
While Bollinger Bands are a popular technical analysis tool used by traders to analyze and interpret stock price movements and they can provide valuable insights, they are not without their limitations and potential problems. Here are some of the issues associated with using Bollinger Bands:
- Whipsawing in Range-Bound Markets: Bollinger Bands are often less effective in range-bound or sideways markets. In such conditions, prices may repeatedly touch or cross the bands, leading to false signals. Traders can experience whipsawing, where they are triggered in and out of positions without capturing significant price moves.
- Lagging Indicator: Bollinger Bands are primarily trend-following indicators. They react to price movements that have already occurred. As a result, they may not provide timely signals for traders looking to capitalize on rapid price changes.
- Unclear Interpretation in Volatile Markets: In highly volatile markets, Bollinger Bands may expand significantly, making it difficult to interpret whether a price move is a breakout or just a result of increased volatility. This can lead to false signals and trading losses.
- Overlapping Bands: The upper and lower bands can overlap, obscuring price action. When the bands are close together, it may be challenging to discern meaningful trading signals.
- Not a Standalone Indicator: Bollinger Bands are most effective when used in conjunction with other technical indicators or chart patterns. Relying solely on Bollinger Bands can be risky, as they do not account for all factors influencing stock prices.
- Doesn't Account for Market News: Bollinger Bands are purely price-based indicators. They do not consider external factors like news events, earnings reports, or geopolitical developments that can have a sudden and significant impact on prices.
- Parameter Sensitivity: The effectiveness of Bollinger Bands depends on the choice of parameters, such as the number of periods and standard deviation multiples. Different parameter settings can produce significantly different signals, leading to confusion for traders.
- No Guarantee of Future Performance: Past price movements, which Bollinger Bands rely on, are not a guarantee of future performance. Markets can change behavior due to various factors, rendering historical patterns less relevant.
- Risk of Overtrading: Traders may be tempted to enter and exit positions too frequently when relying solely on Bollinger Bands. Overtrading can lead to increased transaction costs and potential losses.
- False Breakouts: Bollinger Bands are susceptible to generating false breakout signals. A breakout beyond the bands doesn't always result in a sustained price move. Traders may be trapped in positions that reverse quickly.
- Volatility: Bollinger Bands are more effective in volatile markets. In low-volatility markets, Bollinger Bands may be less effective in generating trading signals.
Despite these potential issues, many traders find value in using Bollinger Bands when they are employed as part of a broader trading strategy. Combining technical indicators, risk management, and an understanding of market conditions can help mitigate some of the problems associated with Bollinger Bands and improve the overall effectiveness of a trading approach.
Conclusion
Bollinger Bands are a versatile and effective technical analysis tool that can be used by traders of all experience levels. However, it is important to be aware of the limitations of Bollinger Bands and to use them in conjunction with other technical indicators and risk management techniques to make informed trading decisions.
Disclaimer: This material is provided for educational and entertainment purposes only. It does not constitute trading or investment advice. Hypothetical performance has inherent limitations.