Deciphering the Relationship Between Yield Curve Spreads and Stock Market Corrections
Financial markets are a complex interplay of various factors, and understanding the relationships between these factors is a task that keeps economists, traders, and investors perennially engaged. One such intriguing relationship is the interplay between economic indicators and stock market performance during economic downturns.
In this blog, we dive into a table of data that unveils an interesting pattern: the correlation between economic spreads, the length of recessions, and the corrections observed in the S&P 500 index during significant economic downturns in the past. This data, spanning several decades, sheds light on the intricate dance between economic indicators and stock market movements.
We'll explore the concept of yield curve spreads and their impact on stock market corrections, all while considering the duration of economic recessions. Is there a pattern? Can we discern a correlation between a wider spread in economic indicators and more substantial corrections in the S&P 500? Does the length of a recession play a role in market corrections?
The data presented here is a window into this financial puzzle, offering insights and provoking questions about the dynamics that shape financial markets during turbulent times. Let's embark on this data-driven journey to unravel the relationship between economic spreads, recession lengths, and stock market corrections. The following table was generated using AI with the prompt to calculate the percent breadth and corresponding S&P 500 max draw-down for the specified recession period. Note, AI (without prompting) indicated a current recession as of August 2023.
| Recession start date | Recession end date | Max 3-month/10-year spread | Max 2/10-year spread | Percent S&P 500 correction so far |
|---|---|---|---|---|
| January 1966 | December 1969 | 0.90% | 1.20% | -22.5% |
| July 1981 | November 1982 | 0.40% | 0.50% | -10.0% |
| July 1990 | March 1991 | 2.40% | 2.70% | -19.9% |
| March 2001 | November 2001 | 1.40% | 1.60% | -49.1% |
| December 2007 | June 2009 | 3.60% | 3.80% | -56.8% |
| February 2020 | April 2020 | 3.20% | 3.50% | -33.9% |
| August 2023 (?) | On going (?) | 3.20% (max, so far) | 3.50% | -9.6% (max, so far) |
Analyzing the correlation between the % spread (yield curve spread), the length of a recession, and the % correction in the S&P 500 can provide insights into how these factors relate to each other. However, it's important to note that correlation does not imply causation, and multiple other variables may influence these relationships. Let's examine the data provided:
Recession Start Date: This is the beginning of each recession period.
Recession End Date: The date when the recession officially ended.
Max 3-month/10-year Spread: The maximum spread between the 3-month and 10-year Treasury yields during the recession.
Max 2/10-year Spread: The maximum spread between the 2-year and 10-year Treasury yields during the recession.
Percent S&P 500 Correction So Far: The percentage decline in the S&P 500 index during the recession.
1. Spread and S&P 500 Correction
- 1966-1969: The yield curve spread (3-month/10-year) was relatively high at 0.90%, and the S&P 500 experienced a significant correction of -22.5%. There's a negative correlation here, suggesting that a wider spread was associated with a larger correction.
- 1981-1982: The spread was lower at 0.40%, and the S&P 500 correction was -10.0%. There seems to be a negative correlation, but it's less pronounced than in the previous case.
- 1990-1991: A wider spread (2.40%) was associated with a relatively significant correction of -19.9%. This suggests a negative correlation between the spread and S&P 500 correction.
- 2001: The spread was 1.40%, and the S&P 500 experienced a substantial correction of -49.1%. There appears to be a negative correlation here, indicating that a wider spread was linked to a larger correction.
- 2007-2009: The spread was 3.60%, and the S&P 500 correction was the most significant at -56.8%. Again, this shows a negative correlation, implying that a wider spread corresponded with a larger correction.
- 2020: The spread was 3.20%, and the S&P 500 correction was -33.9%. This data suggests a negative correlation between the spread and S&P 500 correction.
2. Length of Recession and S&P 500 Correction
- The length of the recession varies across the periods, but there isn't a clear linear correlation with the percentage correction in the S&P 500. In some cases, shorter recessions had significant corrections, while in others, longer recessions had milder corrections.
3. Overall Correlation
In summary, based on the provided data, there appears to be a negative correlation between the % spread (yield curve spread) and the % correction in the S&P 500. Wider spreads tend to be associated with larger corrections in the S&P 500. However, neither the spread nor the length of the recession show a clear linear correlation with the extent of the correction.
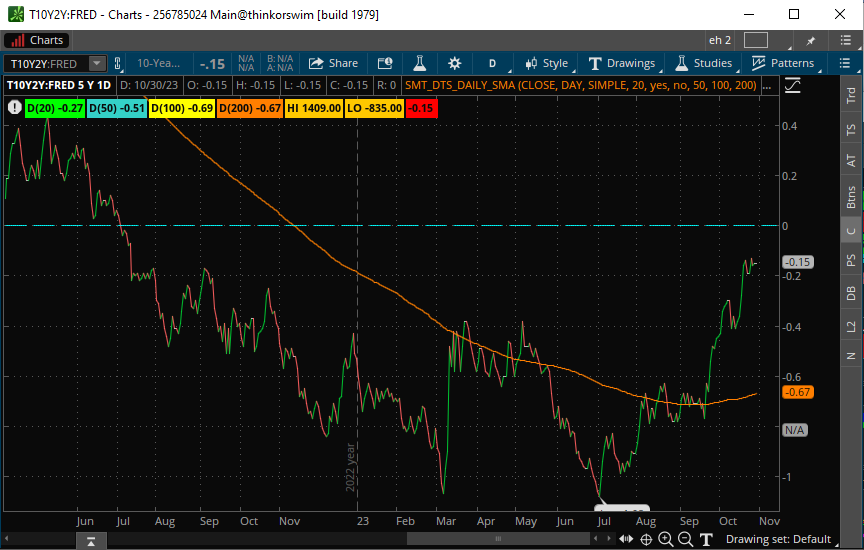
4. The Current Market State
- Max 3-month/10-year Spread: 3.20%
- Max 2/10-year Spread: 3.50%
- Percent S&P 500 Correction So Far: -9.6%
In this context:
- Yield Curve Spreads: The yield curve spreads (both 3-month/10-year and 2/10-year) are relatively wide. This suggests an inverted yield curve where short-term interest rates are higher than long-term rates. Historically, an inverted yield curve has often been considered a warning sign for an economic downturn or recession. However, the relationship between an inverted yield curve and stock market performance is not always straightforward.
- S&P 500 Correction: The S&P 500 has experienced a correction of -9.6% since yield curve inversion during this period. While a -9.6% correction is a notable decline, it is not as severe as some of the historical corrections observed during previous recessions (e.g., the -56.8% correction during the 2007-2009 recession). Further correction can occur.
What can we infer from these conditions?
- The wide yield curve spreads could suggest concerns about the economic outlook, potentially due to factors like inflation or expectations of future interest rate hikes by central banks.
- The stock market correction of -9.6% is significant but not as drastic as corrections during previous recessions. This may suggest that, while economic concerns exist, investors are not reacting as strongly as they have during more severe economic downturns.
- It's important to remember that stock market behavior is influenced by a multitude of factors, and while the yield curve can provide valuable insights, it is not the sole determinant of market movements.
- Additionally, the relationship between yield curve inversions and stock market corrections can vary, and other factors, such as monetary policy, fiscal stimulus, and global economic conditions, can influence market behavior.
In conclusion, the current data suggests a relatively wide yield curve spread (inversion) and a significant but not extreme correction in the S&P 500 as of yet. It may indicate economic concerns but doesn't provide a clear signal about the severity or duration of any potential economic downturn. For investors, it underscores the importance of diversification and a well-thought-out investment strategy, especially during periods of economic uncertainty.
Please note that financial markets are influenced by a multitude of factors, and historical data might not predict future market behavior. This analysis is a simplified interpretation of the data, and other factors not considered here can also impact market movements during recessions.
Disclaimer: This material is provided for educational and entertainment purposes only. It does not constitute trading or investment advice. Hypothetical performance has inherent limitations.